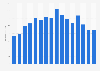
Consumer spending on digital home entertainment in the United States amounted to over ** billion U.S. dollars in 2024. SVOD spending grew by around ** billion U.S. dollars between 2023 and 2024, reflecting the consistent and growing demand for content available on platforms using this model.
*Figures for 2012 to 2016 refer to paid subscribers only and do not include SVOD bundled with other services. As of 2017, figures show SVOD including bundled and unbundled services, representing a larger cross-section of SVOD activity than was reflected in previous reports. The figures for 2012 to 2022 come from previous releases. Figures have been rounded.
Profit from the additional features of your individual account
Currently, you are using a shared account. To use individual functions (e.g., mark statistics as favourites, set
statistic alerts) please log in with your personal account.
If you are an admin, please authenticate by logging in again.
Learn more about how Statista can support your business.
Digital Entertainment Group. (February 6, 2025). Consumer spending on digital home entertainment in the United States from 2012 to 2024, by type (in billion U.S. dollars) [Graph]. In Statista. Retrieved July 11, 2025, from https://www.statista.com/statistics/296345/us-consumer-spendings-on-digital-entertainment-by-type/
Digital Entertainment Group. "Consumer spending on digital home entertainment in the United States from 2012 to 2024, by type (in billion U.S. dollars)." Chart. February 6, 2025. Statista. Accessed July 11, 2025. https://www.statista.com/statistics/296345/us-consumer-spendings-on-digital-entertainment-by-type/
Digital Entertainment Group. (2025). Consumer spending on digital home entertainment in the United States from 2012 to 2024, by type (in billion U.S. dollars). Statista. Statista Inc.. Accessed: July 11, 2025. https://www.statista.com/statistics/296345/us-consumer-spendings-on-digital-entertainment-by-type/
Digital Entertainment Group. "Consumer Spending on Digital Home Entertainment in The United States from 2012 to 2024, by Type (in Billion U.S. Dollars)." Statista, Statista Inc., 6 Feb 2025, https://www.statista.com/statistics/296345/us-consumer-spendings-on-digital-entertainment-by-type/
Digital Entertainment Group, Consumer spending on digital home entertainment in the United States from 2012 to 2024, by type (in billion U.S. dollars) Statista, https://www.statista.com/statistics/296345/us-consumer-spendings-on-digital-entertainment-by-type/ (last visited July 11, 2025)
Consumer spending on digital home entertainment in the United States from 2012 to 2024, by type (in billion U.S. dollars) [Graph], Digital Entertainment Group, February 6, 2025. [Online]. Available: https://www.statista.com/statistics/296345/us-consumer-spendings-on-digital-entertainment-by-type/