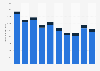
In the fiscal year ending March 31, 2025, the Chinese e-commerce corporation Alibaba Group reported a consolidated annual revenue of around 996 billion yuan. The largest share of the revenue, 43 percent, came from the domestic e-commerce retail segment.
Alibaba Group
Founded in 1999, today Alibaba Group is the leading e-commerce provider in China, offering a wide range of B2B, B2C, and C2C services. The company also offers cloud computing, digital entertainment (such as online video platform Youku Tudou), and mobile payment services. As of the beginning of 2023, Alibaba had nearly a billion of annual active consumers on its online shopping marketplaces in China.
Alibaba’s e-commerce retail
Domestic e-commerce retail on the company’s online shopping platforms, such as Taobao and Tmall, generated a total revenue of more than 425.5 billion yuan in 2025, around 11 billion yuan more than in the previous year. Direct sales increased the most, primarily due to strong sales driven by consumer electronics and appliances. International e-commerce retail accounted for only 11 percent of Alibaba’s revenue; however, the segment revenue grew by 33 percent in 2025 compared to the previous year. This was the result of combined order growth, large revenue contribution from AliExpress’ Choice, as well as improvements in monetization.
Advertisement
Advertisement
Annual revenue distribution of Alibaba in financial years 2023 and 2025, by selected segment
*Others include Sun Art, Freshippo, Alibaba Health, Lingxi Games, Intime, Intelligent Information Platform (which mainly consists of UCWeb and Quark businesses), Fliggy, DingTalk (previously reported under Cloud Intelligence Group segment) and other businesses. The majority of revenue within "other" consist of direct sales revenue, which is recorded on a gross basis.
Percentage shares were calculated by Statista based on revenue numbers published by Alibaba group. Values have been rounded. Percentages may not total 100 due to rounding.
Revenue segments were restructured in FY 2024. The most recent reporting has been updated for FY 2023. FY 2023-2024 data is not comparable to the segment results of the previous years.
Profit from the additional features of your individual account
Currently, you are using a shared account. To use individual functions (e.g., mark statistics as favourites, set
statistic alerts) please log in with your personal account.
If you are an admin, please authenticate by logging in again.
Learn more about how Statista can support your business.
Alibaba. (May 15, 2025). Annual revenue distribution of Alibaba in financial years 2023 and 2025, by selected segment [Graph]. In Statista. Retrieved June 27, 2025, from https://www.statista.com/statistics/298817/alibaba-revenue-distribution-segment/
Alibaba. "Annual revenue distribution of Alibaba in financial years 2023 and 2025, by selected segment." Chart. May 15, 2025. Statista. Accessed June 27, 2025. https://www.statista.com/statistics/298817/alibaba-revenue-distribution-segment/
Alibaba. (2025). Annual revenue distribution of Alibaba in financial years 2023 and 2025, by selected segment. Statista. Statista Inc.. Accessed: June 27, 2025. https://www.statista.com/statistics/298817/alibaba-revenue-distribution-segment/
Alibaba. "Annual Revenue Distribution of Alibaba in Financial Years 2023 and 2025, by Selected Segment." Statista, Statista Inc., 15 May 2025, https://www.statista.com/statistics/298817/alibaba-revenue-distribution-segment/
Alibaba, Annual revenue distribution of Alibaba in financial years 2023 and 2025, by selected segment Statista, https://www.statista.com/statistics/298817/alibaba-revenue-distribution-segment/ (last visited June 27, 2025)
Annual revenue distribution of Alibaba in financial years 2023 and 2025, by selected segment [Graph], Alibaba, May 15, 2025. [Online]. Available: https://www.statista.com/statistics/298817/alibaba-revenue-distribution-segment/