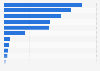
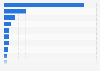
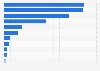
Inner Mongolia is the Chinese province with the greatest installed capacity of wind power plants. As of May 2022, cumulative wind power capacity amounted to just over 36 gigawatts. This was roughly 14 gigawatts more than the capacity in Xinjiang, which ranked second.
Advertisement
Advertisement
Capacity of operational wind power farms in China as of May 2022, by province/municipality
(in megawatts)
Profit from the additional features of your individual account
Currently, you are using a shared account. To use individual functions (e.g., mark statistics as favourites, set
statistic alerts) please log in with your personal account.
If you are an admin, please authenticate by logging in again.
Learn more about how Statista can support your business.
Global Energy Monitor. (May 30, 2022). Capacity of operational wind power farms in China as of May 2022, by province/municipality (in megawatts) [Graph]. In Statista. Retrieved June 18, 2025, from https://www.statista.com/statistics/302350/china-installed-wind-power-capacity-by-region/
Global Energy Monitor. "Capacity of operational wind power farms in China as of May 2022, by province/municipality (in megawatts)." Chart. May 30, 2022. Statista. Accessed June 18, 2025. https://www.statista.com/statistics/302350/china-installed-wind-power-capacity-by-region/
Global Energy Monitor. (2022). Capacity of operational wind power farms in China as of May 2022, by province/municipality (in megawatts). Statista. Statista Inc.. Accessed: June 18, 2025. https://www.statista.com/statistics/302350/china-installed-wind-power-capacity-by-region/
Global Energy Monitor. "Capacity of Operational Wind Power Farms in China as of May 2022, by Province/Municipality (in Megawatts)." Statista, Statista Inc., 30 May 2022, https://www.statista.com/statistics/302350/china-installed-wind-power-capacity-by-region/
Global Energy Monitor, Capacity of operational wind power farms in China as of May 2022, by province/municipality (in megawatts) Statista, https://www.statista.com/statistics/302350/china-installed-wind-power-capacity-by-region/ (last visited June 18, 2025)
Capacity of operational wind power farms in China as of May 2022, by province/municipality (in megawatts) [Graph], Global Energy Monitor, May 30, 2022. [Online]. Available: https://www.statista.com/statistics/302350/china-installed-wind-power-capacity-by-region/