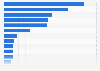
This statistic shows the sales of shelf-stable seafood in the United States, sorted by seafood type in 2012. In that year, canned salmon reached sales amounting to approximately 129.4 million U.S. dollars, while canned oysters captured sales of 27.6 million U.S. dollars.
Advertisement
Advertisement
Sales of shelf-stable seafood in the United States in 2012, by type (in million U.S dollars)*
Profit from the additional features of your individual account
Currently, you are using a shared account. To use individual functions (e.g., mark statistics as favourites, set
statistic alerts) please log in with your personal account.
If you are an admin, please authenticate by logging in again.
Learn more about how Statista can support your business.
Progressive Grocer. (March 1, 2013). Sales of shelf-stable seafood in the United States in 2012, by type (in million U.S dollars)* [Graph]. In Statista. Retrieved June 14, 2025, from https://www.statista.com/statistics/304693/us-sales-of-shelf-stable-seafood-by-type/
Progressive Grocer. "Sales of shelf-stable seafood in the United States in 2012, by type (in million U.S dollars)*." Chart. March 1, 2013. Statista. Accessed June 14, 2025. https://www.statista.com/statistics/304693/us-sales-of-shelf-stable-seafood-by-type/
Progressive Grocer. (2013). Sales of shelf-stable seafood in the United States in 2012, by type (in million U.S dollars)*. Statista. Statista Inc.. Accessed: June 14, 2025. https://www.statista.com/statistics/304693/us-sales-of-shelf-stable-seafood-by-type/
Progressive Grocer. "Sales of Shelf-stable Seafood in The United States in 2012, by Type (in Million U.S Dollars)*." Statista, Statista Inc., 1 Mar 2013, https://www.statista.com/statistics/304693/us-sales-of-shelf-stable-seafood-by-type/
Progressive Grocer, Sales of shelf-stable seafood in the United States in 2012, by type (in million U.S dollars)* Statista, https://www.statista.com/statistics/304693/us-sales-of-shelf-stable-seafood-by-type/ (last visited June 14, 2025)
Sales of shelf-stable seafood in the United States in 2012, by type (in million U.S dollars)* [Graph], Progressive Grocer, March 1, 2013. [Online]. Available: https://www.statista.com/statistics/304693/us-sales-of-shelf-stable-seafood-by-type/