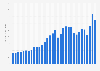
In 2022, in-store sales per U.S. convenience store amounted to approximately 1.85 million U.S. dollars. In the convenience store sector, in-store sales are typically split into two categories: merchandise and foodservice.
Advertisement
Advertisement
In-store sales per convenience store in the United States from 2014 to 2022
(in U.S. dollars)
Profit from the additional features of your individual account
Currently, you are using a shared account. To use individual functions (e.g., mark statistics as favourites, set
statistic alerts) please log in with your personal account.
If you are an admin, please authenticate by logging in again.
Learn more about how Statista can support your business.
Convenience Store News. (June 1, 2023). In-store sales per convenience store in the United States from 2014 to 2022 (in U.S. dollars) [Graph]. In Statista. Retrieved June 17, 2025, from https://www.statista.com/statistics/308780/in-store-sales-per-convenience-store-in-the-us/
Convenience Store News. "In-store sales per convenience store in the United States from 2014 to 2022 (in U.S. dollars)." Chart. June 1, 2023. Statista. Accessed June 17, 2025. https://www.statista.com/statistics/308780/in-store-sales-per-convenience-store-in-the-us/
Convenience Store News. (2023). In-store sales per convenience store in the United States from 2014 to 2022 (in U.S. dollars). Statista. Statista Inc.. Accessed: June 17, 2025. https://www.statista.com/statistics/308780/in-store-sales-per-convenience-store-in-the-us/
Convenience Store News. "In-store Sales per Convenience Store in The United States from 2014 to 2022 (in U.S. Dollars)." Statista, Statista Inc., 1 Jun 2023, https://www.statista.com/statistics/308780/in-store-sales-per-convenience-store-in-the-us/
Convenience Store News, In-store sales per convenience store in the United States from 2014 to 2022 (in U.S. dollars) Statista, https://www.statista.com/statistics/308780/in-store-sales-per-convenience-store-in-the-us/ (last visited June 17, 2025)
In-store sales per convenience store in the United States from 2014 to 2022 (in U.S. dollars) [Graph], Convenience Store News, June 1, 2023. [Online]. Available: https://www.statista.com/statistics/308780/in-store-sales-per-convenience-store-in-the-us/