This statistic displays the revenue of GNC (General Nutrition Corporation) by segment in 2017, 2018, and 2019. In 2017, GNC generated 2.02 billion U.S. dollars from its U.S. and Canada operations. General Nutrition Corporation is focused on the retail of health and nutrition products, especially vitamins, minerals, and other supplements. The company is headquartered in Pittsburgh, Pennsylvania.
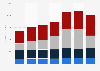
General Nutrition Corporation's (GNC) revenue from 2017 to 2019, by segment*
(in million U.S. dollars)
Characteristic
2017
2018
2019
Manufacturing/Wholesale
449.6
475.1
123.2
International
177.8
191.4
158.2
U.S. and Canada
2,018.9
1,951.2
1,822.3
05001,0001,5002,0002,500
Add this content to your personal favorites. These can be accessed from the favorites menu in the main navigation.
You have no right to use this feature.
Make sure to contact us if you are interested in scientific citation.
You can upgrade your account to enable this functionality for all statistics.
This feature is not available with your current account.Request access
Learn more about how Statista can support your business.
GNC. (March 25, 2020). General Nutrition Corporation's (GNC) revenue from 2017 to 2019, by segment* (in million U.S. dollars) [Graph]. In Statista. Retrieved June 08, 2025, from https://www.statista.com/statistics/309033/revenue-of-gnc-by-segment/
GNC. "General Nutrition Corporation's (GNC) revenue from 2017 to 2019, by segment* (in million U.S. dollars)." Chart. March 25, 2020. Statista. Accessed June 08, 2025. https://www.statista.com/statistics/309033/revenue-of-gnc-by-segment/
GNC. (2020). General Nutrition Corporation's (GNC) revenue from 2017 to 2019, by segment* (in million U.S. dollars). Statista. Statista Inc.. Accessed: June 08, 2025. https://www.statista.com/statistics/309033/revenue-of-gnc-by-segment/
GNC. "General Nutrition Corporation's (Gnc) Revenue from 2017 to 2019, by Segment* (in Million U.S. Dollars)." Statista, Statista Inc., 25 Mar 2020, https://www.statista.com/statistics/309033/revenue-of-gnc-by-segment/
GNC, General Nutrition Corporation's (GNC) revenue from 2017 to 2019, by segment* (in million U.S. dollars) Statista, https://www.statista.com/statistics/309033/revenue-of-gnc-by-segment/ (last visited June 08, 2025)
General Nutrition Corporation's (GNC) revenue from 2017 to 2019, by segment* (in million U.S. dollars) [Graph], GNC, March 25, 2020. [Online]. Available: https://www.statista.com/statistics/309033/revenue-of-gnc-by-segment/
Profit from additional features with an Employee Account
Please create an employee account to be able to mark statistics as favorites.
Then you can access your favorite statistics via the star in the header.
Profit from the additional features of your individual account
Currently, you are using a shared account. To use individual functions (e.g., mark statistics as favourites, set
statistic alerts) please log in with your personal account.
If you are an admin, please authenticate by logging in again.