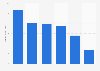
In the 52 weeks ending December 29, 2024, U.S. in-store convenience store sales of sports drinks amounted to about 4.9 billion U.S. dollars. In contrast, canned and bottled tea registered sales of just over 1.6 million dollars. In that year, convenience stores across the country sold close to 1.7 billion units of sports drinks.
Advertisement
Advertisement
Sales of packaged beverages in convenience stores (c-stores) in the United States in 2024, by type
(in million U.S. dollars)
Profit from the additional features of your individual account
Currently, you are using a shared account. To use individual functions (e.g., mark statistics as favourites, set
statistic alerts) please log in with your personal account.
If you are an admin, please authenticate by logging in again.
Learn more about how Statista can support your business.
CSP. (April 4, 2025). Sales of packaged beverages in convenience stores (c-stores) in the United States in 2024, by type (in million U.S. dollars) [Graph]. In Statista. Retrieved June 20, 2025, from https://www.statista.com/statistics/309327/industry-total-sales-of-packaged-beverages-in-the-us/
CSP. "Sales of packaged beverages in convenience stores (c-stores) in the United States in 2024, by type (in million U.S. dollars)." Chart. April 4, 2025. Statista. Accessed June 20, 2025. https://www.statista.com/statistics/309327/industry-total-sales-of-packaged-beverages-in-the-us/
CSP. (2025). Sales of packaged beverages in convenience stores (c-stores) in the United States in 2024, by type (in million U.S. dollars). Statista. Statista Inc.. Accessed: June 20, 2025. https://www.statista.com/statistics/309327/industry-total-sales-of-packaged-beverages-in-the-us/
CSP. "Sales of Packaged Beverages in Convenience Stores (C-stores) in The United States in 2024, by Type (in Million U.S. Dollars)." Statista, Statista Inc., 4 Apr 2025, https://www.statista.com/statistics/309327/industry-total-sales-of-packaged-beverages-in-the-us/
CSP, Sales of packaged beverages in convenience stores (c-stores) in the United States in 2024, by type (in million U.S. dollars) Statista, https://www.statista.com/statistics/309327/industry-total-sales-of-packaged-beverages-in-the-us/ (last visited June 20, 2025)
Sales of packaged beverages in convenience stores (c-stores) in the United States in 2024, by type (in million U.S. dollars) [Graph], CSP, April 4, 2025. [Online]. Available: https://www.statista.com/statistics/309327/industry-total-sales-of-packaged-beverages-in-the-us/