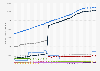
This statistic gives information on the time spent on digital media in the United States from June 2013 to June 2016. During that month, users in the United States spent 864 billion minutes on mobile apps, up from 779 billion minutes in the previous year.
Time spent on digital media in the United States from June 2013 to June 2016
(in billion monthly minutes)
Characteristic
Mobile web
Mobile apps
Desktop
Jun '13
77.08
409.85
476.55
Jun '14
97.44
621.41
480.97
Jun '15
118.3
778.95
550.52
Jun '16
124.79
864.33
491.74
02004006008001,000
Add this content to your personal favorites. These can be accessed from the favorites menu in the main navigation.
You have no right to use this feature.
Make sure to contact us if you are interested in scientific citation.
You can upgrade your account to enable this functionality for all statistics.
This feature is not available with your current account.Request access
Learn more about how Statista can support your business.
comScore, & Applause. (September 13, 2016). Time spent on digital media in the United States from June 2013 to June 2016 (in billion monthly minutes) [Graph]. In Statista. Retrieved May 04, 2025, from https://www.statista.com/statistics/311298/time-spent-on-digital-media-channels-us/
comScore, und Applause. "Time spent on digital media in the United States from June 2013 to June 2016 (in billion monthly minutes)." Chart. September 13, 2016. Statista. Accessed May 04, 2025. https://www.statista.com/statistics/311298/time-spent-on-digital-media-channels-us/
comScore, Applause. (2016). Time spent on digital media in the United States from June 2013 to June 2016 (in billion monthly minutes). Statista. Statista Inc.. Accessed: May 04, 2025. https://www.statista.com/statistics/311298/time-spent-on-digital-media-channels-us/
comScore, and Applause. "Time Spent on Digital Media in The United States from June 2013 to June 2016 (in Billion Monthly Minutes)." Statista, Statista Inc., 13 Sep 2016, https://www.statista.com/statistics/311298/time-spent-on-digital-media-channels-us/
comScore & Applause, Time spent on digital media in the United States from June 2013 to June 2016 (in billion monthly minutes) Statista, https://www.statista.com/statistics/311298/time-spent-on-digital-media-channels-us/ (last visited May 04, 2025)
Time spent on digital media in the United States from June 2013 to June 2016 (in billion monthly minutes) [Graph], comScore, & Applause, September 13, 2016. [Online]. Available: https://www.statista.com/statistics/311298/time-spent-on-digital-media-channels-us/
Profit from additional features with an Employee Account
Please create an employee account to be able to mark statistics as favorites.
Then you can access your favorite statistics via the star in the header.
Profit from the additional features of your individual account
Currently, you are using a shared account. To use individual functions (e.g., mark statistics as favourites, set
statistic alerts) please log in with your personal account.
If you are an admin, please authenticate by logging in again.