Adjust the presentation of the statistic and data points.
Share the statistic on social media channels or embed the statistic in your
website using "Embed Code", where available.
Cite this statistic and select one of the following formats: APA, Chicago, Harvard, MLA & Bluebook.
Print the statistic including description and metadata.
Chart type
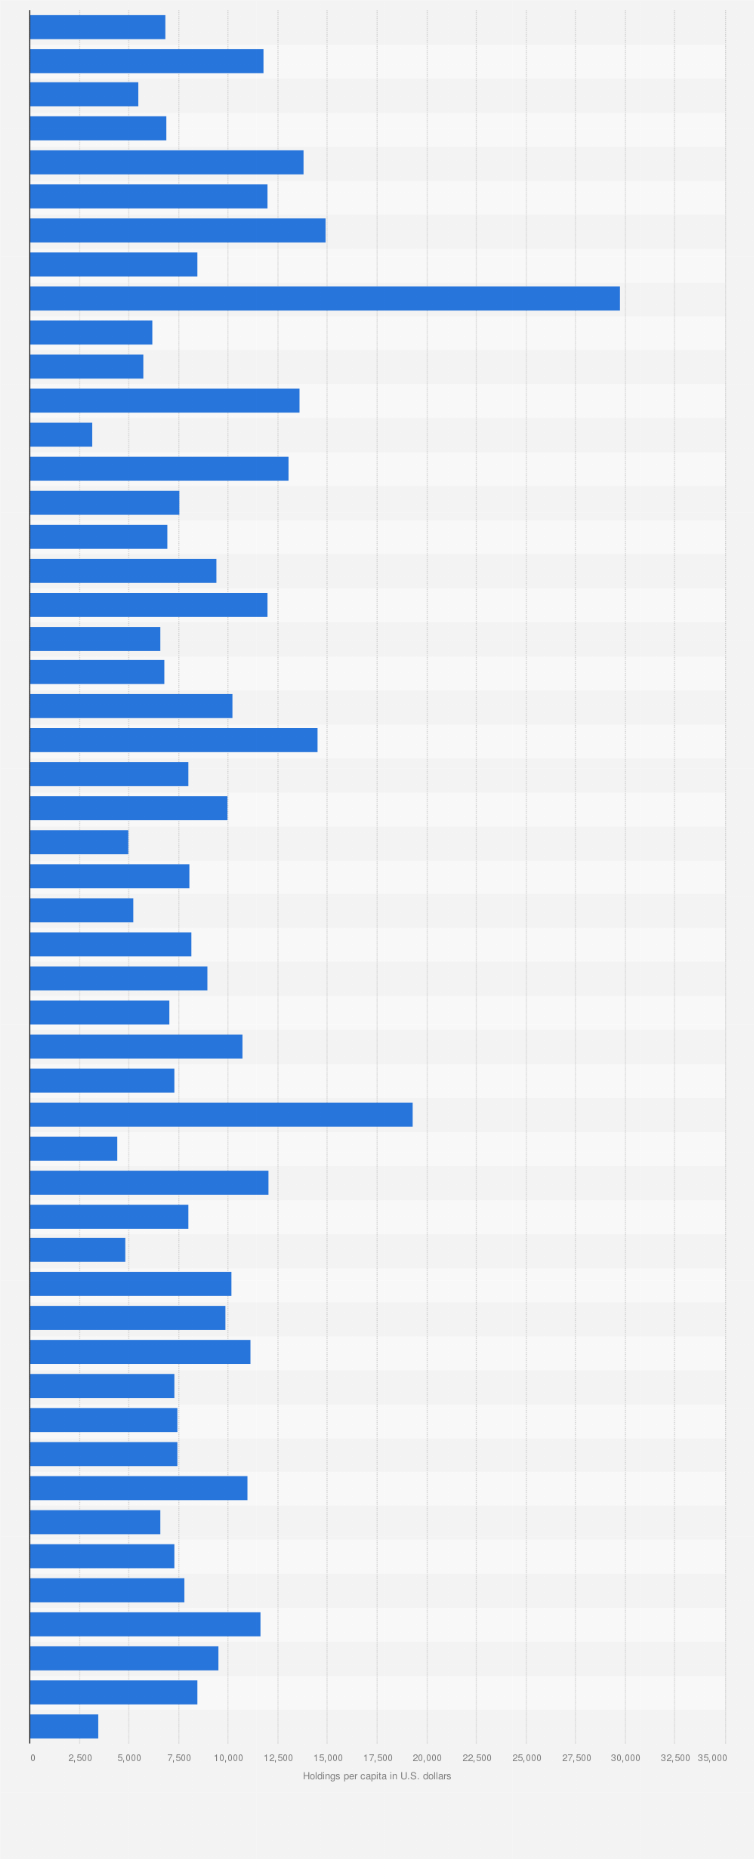
Per capita state and local government debt outstanding in the United States in 2022, by state
Share this statistic
You have no right to use this feature.
Make sure to contact us if you are interested in scientific citation.
You can upgrade your account to enable this functionality for all statistics.
This feature is not available with your current account.Request access
Data includes short-term, long-term, full faith and credit, nonguaranteed, and public debt for private purposes.
Per capita figures were calculated by Statista using 2021 population data by the United States Census Bureau which can be found here.
Learn more about how Statista can support your business.
US Census Bureau. (October 30, 2024). Per capita state and local government debt outstanding in the United States in 2022, by state (in U.S. dollars) [Graph]. In Statista. Retrieved June 28, 2025, from https://www.statista.com/statistics/312681/per-capita-us-state-and-local-government-debt-outstanding-by-state/
US Census Bureau. "Per capita state and local government debt outstanding in the United States in 2022, by state (in U.S. dollars)." Chart. October 30, 2024. Statista. Accessed June 28, 2025. https://www.statista.com/statistics/312681/per-capita-us-state-and-local-government-debt-outstanding-by-state/
US Census Bureau. (2024). Per capita state and local government debt outstanding in the United States in 2022, by state (in U.S. dollars). Statista. Statista Inc.. Accessed: June 28, 2025. https://www.statista.com/statistics/312681/per-capita-us-state-and-local-government-debt-outstanding-by-state/
US Census Bureau. "Per Capita State and Local Government Debt Outstanding in The United States in 2022, by State (in U.S. Dollars)." Statista, Statista Inc., 30 Oct 2024, https://www.statista.com/statistics/312681/per-capita-us-state-and-local-government-debt-outstanding-by-state/
US Census Bureau, Per capita state and local government debt outstanding in the United States in 2022, by state (in U.S. dollars) Statista, https://www.statista.com/statistics/312681/per-capita-us-state-and-local-government-debt-outstanding-by-state/ (last visited June 28, 2025)
Per capita state and local government debt outstanding in the United States in 2022, by state (in U.S. dollars) [Graph], US Census Bureau, October 30, 2024. [Online]. Available: https://www.statista.com/statistics/312681/per-capita-us-state-and-local-government-debt-outstanding-by-state/
Advertisement
Profit from additional features with an Employee Account
Please create an employee account to be able to mark statistics as favorites.
Then you can access your favorite statistics via the star in the header.
Profit from the additional features of your individual account
Currently, you are using a shared account. To use individual functions (e.g., mark statistics as favourites, set
statistic alerts) please log in with your personal account.
If you are an admin, please authenticate by logging in again.