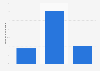
This statistic shows the nominal and per capita dispensed prescription growth between 2004 and 2013 in the United States. In 2006, the implementation of Medicare part D generated a *** percent nominal increase in prescriptions and *** percent growth in per capita prescriptions. Prescription demand is slowly increasing again after the economic crisis in 2009 to 2011.
Dispensed prescriptions in retail pharmacies, excluding mail order and long-term care pharmacies. Prescriptions are normalized to reflect consistent prescription
sizes. Prescriptions can be of different durations and this has been shown to vary significantly and to change over time. Increasing numbers of 3-month
prescriptions over time result in fewer prescriptions. This analysis adjusts all prescriptions to the national average number of extended units per prescription.
Profit from the additional features of your individual account
Currently, you are using a shared account. To use individual functions (e.g., mark statistics as favourites, set
statistic alerts) please log in with your personal account.
If you are an admin, please authenticate by logging in again.
Learn more about how Statista can support your business.
IMS Health. (April 30, 2014). Change in nominal and per capita dispensed prescriptions in United States from 2004 to 2013 [Graph]. In Statista. Retrieved July 12, 2025, from https://www.statista.com/statistics/315460/total-and-per-capita-prescription-change-in-the-us/
IMS Health. "Change in nominal and per capita dispensed prescriptions in United States from 2004 to 2013." Chart. April 30, 2014. Statista. Accessed July 12, 2025. https://www.statista.com/statistics/315460/total-and-per-capita-prescription-change-in-the-us/
IMS Health. (2014). Change in nominal and per capita dispensed prescriptions in United States from 2004 to 2013. Statista. Statista Inc.. Accessed: July 12, 2025. https://www.statista.com/statistics/315460/total-and-per-capita-prescription-change-in-the-us/
IMS Health. "Change in Nominal and per Capita Dispensed Prescriptions in United States from 2004 to 2013." Statista, Statista Inc., 30 Apr 2014, https://www.statista.com/statistics/315460/total-and-per-capita-prescription-change-in-the-us/
IMS Health, Change in nominal and per capita dispensed prescriptions in United States from 2004 to 2013 Statista, https://www.statista.com/statistics/315460/total-and-per-capita-prescription-change-in-the-us/ (last visited July 12, 2025)
Change in nominal and per capita dispensed prescriptions in United States from 2004 to 2013 [Graph], IMS Health, April 30, 2014. [Online]. Available: https://www.statista.com/statistics/315460/total-and-per-capita-prescription-change-in-the-us/