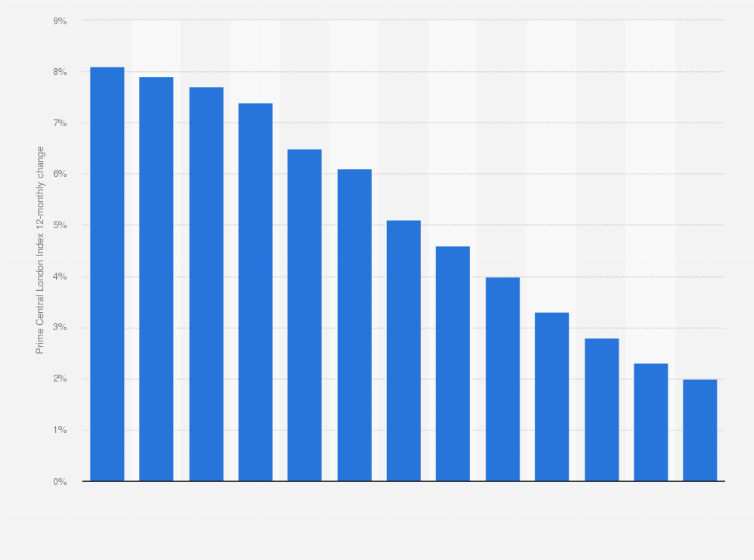
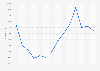
This statistic shows the 12-month development of the Prime Central London Index for Central London's prime property sales on the residential market, between June 2014 and June 2015. Annual growth in June 2015 slowed to 2 percent from 8.1 percent a year ago.
Adjust the presentation of the statistic and data points.
Share the statistic on social media channels or embed the statistic in your
website using "Embed Code", where available.
Cite this statistic and select one of the following formats: APA, Chicago, Harvard, MLA & Bluebook.
Print the statistic including description and metadata.
Chart type
Change in the 12-month index for prime residential property sales in Central London (UK) from June 2014 to June 2015
Share this statistic
You have no right to use this feature.
Make sure to contact us if you are interested in scientific citation.
You can upgrade your account to enable this functionality for all statistics.
This feature is not available with your current account.Request access
The prime property market is made up of properties priced at 500 thousand British pounds or more.
12-month index change signifies that levels are compared in intervals of 12 months and relative change is recorded, for example between May 2014 and May 2015.
Learn more about how Statista can support your business.
Knight Frank. (July 29, 2015). Change in the 12-month index for prime residential property sales in Central London (UK) from June 2014 to June 2015 [Graph]. In Statista. Retrieved June 18, 2025, from https://www.statista.com/statistics/323561/change-12-month-index-for-prime-residential-property-sales-in-central-london-uk/
Knight Frank. "Change in the 12-month index for prime residential property sales in Central London (UK) from June 2014 to June 2015." Chart. July 29, 2015. Statista. Accessed June 18, 2025. https://www.statista.com/statistics/323561/change-12-month-index-for-prime-residential-property-sales-in-central-london-uk/
Knight Frank. (2015). Change in the 12-month index for prime residential property sales in Central London (UK) from June 2014 to June 2015. Statista. Statista Inc.. Accessed: June 18, 2025. https://www.statista.com/statistics/323561/change-12-month-index-for-prime-residential-property-sales-in-central-london-uk/
Knight Frank. "Change in The 12-month Index for Prime Residential Property Sales in Central London (Uk) from June 2014 to June 2015." Statista, Statista Inc., 29 Jul 2015, https://www.statista.com/statistics/323561/change-12-month-index-for-prime-residential-property-sales-in-central-london-uk/
Knight Frank, Change in the 12-month index for prime residential property sales in Central London (UK) from June 2014 to June 2015 Statista, https://www.statista.com/statistics/323561/change-12-month-index-for-prime-residential-property-sales-in-central-london-uk/ (last visited June 18, 2025)
Change in the 12-month index for prime residential property sales in Central London (UK) from June 2014 to June 2015 [Graph], Knight Frank, July 29, 2015. [Online]. Available: https://www.statista.com/statistics/323561/change-12-month-index-for-prime-residential-property-sales-in-central-london-uk/
Advertisement
Profit from additional features with an Employee Account
Please create an employee account to be able to mark statistics as favorites.
Then you can access your favorite statistics via the star in the header.
Profit from the additional features of your individual account
Currently, you are using a shared account. To use individual functions (e.g., mark statistics as favourites, set
statistic alerts) please log in with your personal account.
If you are an admin, please authenticate by logging in again.