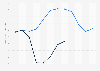
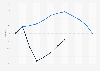
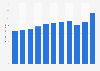
The drinking places sector in Canada was directly affected by stay-at-home measures implemented during to the coronavirus (COVID-19) pandemic in 2020. Sales in this sector fell during the second quarter of the year to around 19.09 million Canadian dollars. As of November 2024, sales from the sector reached nearly 208 million Canadian dollars.
Monthly sales of drinking places in Canada from 2019 to 2024
(in thousand Canadian dollars)
Characteristic
Sales in thousand Canadian dollars
Nov '24
207.94
Oct '24
204.6
Sep '24
205.6
Aug '24
204.56
Jul '24
204.29
Jun '24
207.43
May '24
202.71
Apr '24
205.56
Mar '24
206.02
Feb '24
207
Jan '24
207.02
Dec '23
209.75
Nov '23
206.45
Oct '23
208.98
Sep '23
211.82
Aug '23
210.63
Jul '23
210.92
Jun '23
207.99
May '23
206.38
Apr '23
197.7
Mar '23
205.64
Feb '23
209.85
Jan '23
222.04
Dec '22
217.2
Nov '22
213.45
Oct '22
212.97
Sep '22
210.95
Aug '22
209.82
Jul '22
207.85
Jun '22
204.87
May '22
205.9
Apr '22
197.84
Mar '22
193.61
Feb '22
144.16
Jan '22
105.39
Dec '21
143.64
Nov '21
176.35
Oct '21
158.94
Sep '21
172.06
Aug '21
196.04
Jul '21
171.88
Jun '21
139.14
May '21
75.51
Apr '21
75.81
Mar '21
94.24
Feb '21
82.28
Jan '21
62.92
Dec '20
77.92
Nov '20
96.07
Oct '20
107.13
Sep '20
133.28
Aug '20
143.89
Jul '20
100.51
Jun '20
66.54
May '20
28.58
Apr '20
19.09
Mar '20
90.52
Feb '20
205.8
Jan '20
202.48
Dec '19
208.26
Nov '19
205.45
Oct '19
206.02
Sep '19
204.66
Aug '19
213.6
Jul '19
224.55
Jun '19
218.97
May '19
209.62
Apr '19
212.45
Mar '19
218.85
Feb '19
175.06
Jan '19
214.06
Zoomable Statistic: Select the range in the chart you want to zoom in on.
Sales of alcoholic beverages. Figures were seasonally adjusted. Release date was date accessed. Adapted from Statistics Canada, statcan.gc.ca, January 2019 to August 2023. This does not constitute an endorsement by Statistics Canada of this product.
Profit from the additional features of your individual account
Currently, you are using a shared account. To use individual functions (e.g., mark statistics as favourites, set
statistic alerts) please log in with your personal account.
If you are an admin, please authenticate by logging in again.
Learn more about how Statista can support your business.
StatCan. (January 22, 2025). Monthly sales of drinking places in Canada from 2019 to 2024 (in thousand Canadian dollars) [Graph]. In Statista. Retrieved May 09, 2025, from https://www.statista.com/statistics/323660/sales-of-drinking-places-in-canada/
StatCan. "Monthly sales of drinking places in Canada from 2019 to 2024 (in thousand Canadian dollars)." Chart. January 22, 2025. Statista. Accessed May 09, 2025. https://www.statista.com/statistics/323660/sales-of-drinking-places-in-canada/
StatCan. (2025). Monthly sales of drinking places in Canada from 2019 to 2024 (in thousand Canadian dollars). Statista. Statista Inc.. Accessed: May 09, 2025. https://www.statista.com/statistics/323660/sales-of-drinking-places-in-canada/
StatCan. "Monthly Sales of Drinking Places in Canada from 2019 to 2024 (in Thousand Canadian Dollars)." Statista, Statista Inc., 22 Jan 2025, https://www.statista.com/statistics/323660/sales-of-drinking-places-in-canada/
StatCan, Monthly sales of drinking places in Canada from 2019 to 2024 (in thousand Canadian dollars) Statista, https://www.statista.com/statistics/323660/sales-of-drinking-places-in-canada/ (last visited May 09, 2025)
Monthly sales of drinking places in Canada from 2019 to 2024 (in thousand Canadian dollars) [Graph], StatCan, January 22, 2025. [Online]. Available: https://www.statista.com/statistics/323660/sales-of-drinking-places-in-canada/