Profit from the additional features of your individual account
Currently, you are using a shared account. To use individual functions (e.g., mark statistics as favourites, set
statistic alerts) please log in with your personal account.
If you are an admin, please authenticate by logging in again.
Learn more about how Statista can support your business.
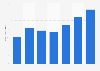
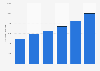
National Bureau of Statistics of China. (October 31, 2016). Number of parcels sent in Taiwan from 2008 to 2015 (in 1,000 s) [Graph]. In Statista. Retrieved June 20, 2025, from https://www.statista.com/statistics/324610/taiwan-parcels-sent/
National Bureau of Statistics of China. "Number of parcels sent in Taiwan from 2008 to 2015 (in 1,000 s)." Chart. October 31, 2016. Statista. Accessed June 20, 2025. https://www.statista.com/statistics/324610/taiwan-parcels-sent/
National Bureau of Statistics of China. (2016). Number of parcels sent in Taiwan from 2008 to 2015 (in 1,000 s). Statista. Statista Inc.. Accessed: June 20, 2025. https://www.statista.com/statistics/324610/taiwan-parcels-sent/
National Bureau of Statistics of China. "Number of Parcels Sent in Taiwan from 2008 to 2015 (in 1,000 S)." Statista, Statista Inc., 31 Oct 2016, https://www.statista.com/statistics/324610/taiwan-parcels-sent/
National Bureau of Statistics of China, Number of parcels sent in Taiwan from 2008 to 2015 (in 1,000 s) Statista, https://www.statista.com/statistics/324610/taiwan-parcels-sent/ (last visited June 20, 2025)
Number of parcels sent in Taiwan from 2008 to 2015 (in 1,000 s) [Graph], National Bureau of Statistics of China, October 31, 2016. [Online]. Available: https://www.statista.com/statistics/324610/taiwan-parcels-sent/