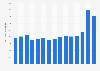
In the fiscal year of 2023, the Singapore-based port operator reported assets of around 27.5 billion Singapore dollars, an increase of around 16 percent from the value of total assets in the fiscal year of 2021.
Advertisement
Advertisement
PSA International's assets from 2009 to 2023
(in million Singapore dollars)
Profit from the additional features of your individual account
Currently, you are using a shared account. To use individual functions (e.g., mark statistics as favourites, set
statistic alerts) please log in with your personal account.
If you are an admin, please authenticate by logging in again.
Learn more about how Statista can support your business.
PSA International. (March 22, 2024). PSA International's assets from 2009 to 2023 (in million Singapore dollars) [Graph]. In Statista. Retrieved June 28, 2025, from https://www.statista.com/statistics/325968/total-assets-of-psa-international/
PSA International. "PSA International's assets from 2009 to 2023 (in million Singapore dollars)." Chart. March 22, 2024. Statista. Accessed June 28, 2025. https://www.statista.com/statistics/325968/total-assets-of-psa-international/
PSA International. (2024). PSA International's assets from 2009 to 2023 (in million Singapore dollars). Statista. Statista Inc.. Accessed: June 28, 2025. https://www.statista.com/statistics/325968/total-assets-of-psa-international/
PSA International. "Psa International's Assets from 2009 to 2023 (in Million Singapore Dollars)." Statista, Statista Inc., 22 Mar 2024, https://www.statista.com/statistics/325968/total-assets-of-psa-international/
PSA International, PSA International's assets from 2009 to 2023 (in million Singapore dollars) Statista, https://www.statista.com/statistics/325968/total-assets-of-psa-international/ (last visited June 28, 2025)
PSA International's assets from 2009 to 2023 (in million Singapore dollars) [Graph], PSA International, March 22, 2024. [Online]. Available: https://www.statista.com/statistics/325968/total-assets-of-psa-international/