The consumer product revenue of Warner Bros. amounted to 12.15 billion U.S. dollars in 2002, over 4.39 billion of which was derived from the company's theatrical product. AT&T acquired Time Warner in June 2018 and assigned Warner Bros., Home Box Office (HBO), and Turner to their new WarnerMedia segment.
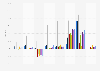
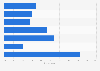
Consumer product revenue of Warner Bros. from 2018 and 2020, by segment
(in million U.S. dollars)
Characteristic
Television product
Theatrical product
Games and other
2020
6,171
4,389
1,594
2019
6,367
5,978
2,013
2018
3,621
4,002
1,080
02,5005,0007,50010,00012,50015,00017,500
Add this content to your personal favorites. These can be accessed from the favorites menu in the main navigation.
You have no right to use this feature.
Make sure to contact us if you are interested in scientific citation.
You can upgrade your account to enable this functionality for all statistics.
This feature is not available with your current account.Request access
Time Warner merged with AT&T on June 14, 2018, thereby changing its name from Time Warner Inc. to Warner Media. The 2018 AT&T Annual report did not include results from Time Warner operations prior to the acquisition.
Learn more about how Statista can support your business.
AT&T. (February 25, 2021). Consumer product revenue of Warner Bros. from 2018 and 2020, by segment (in million U.S. dollars) [Graph]. In Statista. Retrieved May 15, 2025, from https://www.statista.com/statistics/329782/consumer-product-revenue-warner-bros/
AT&T. "Consumer product revenue of Warner Bros. from 2018 and 2020, by segment (in million U.S. dollars)." Chart. February 25, 2021. Statista. Accessed May 15, 2025. https://www.statista.com/statistics/329782/consumer-product-revenue-warner-bros/
AT&T. (2021). Consumer product revenue of Warner Bros. from 2018 and 2020, by segment (in million U.S. dollars). Statista. Statista Inc.. Accessed: May 15, 2025. https://www.statista.com/statistics/329782/consumer-product-revenue-warner-bros/
AT&T. "Consumer Product Revenue of Warner Bros. from 2018 and 2020, by Segment (in Million U.S. Dollars)." Statista, Statista Inc., 25 Feb 2021, https://www.statista.com/statistics/329782/consumer-product-revenue-warner-bros/
AT&T, Consumer product revenue of Warner Bros. from 2018 and 2020, by segment (in million U.S. dollars) Statista, https://www.statista.com/statistics/329782/consumer-product-revenue-warner-bros/ (last visited May 15, 2025)
Consumer product revenue of Warner Bros. from 2018 and 2020, by segment (in million U.S. dollars) [Graph], AT&T, February 25, 2021. [Online]. Available: https://www.statista.com/statistics/329782/consumer-product-revenue-warner-bros/
Profit from additional features with an Employee Account
Please create an employee account to be able to mark statistics as favorites.
Then you can access your favorite statistics via the star in the header.
Profit from the additional features of your individual account
Currently, you are using a shared account. To use individual functions (e.g., mark statistics as favourites, set
statistic alerts) please log in with your personal account.
If you are an admin, please authenticate by logging in again.