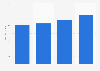
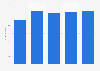
This statistic illustrates sugar substitute sales value growth in United States as of 2018, by type. The stevia category sales grew by 12 percent during the period ended in June 2018, compare to last year.
Advertisement
Advertisement
Sugar substitute sales value growth in United States as of 2018, by type
Profit from the additional features of your individual account
Currently, you are using a shared account. To use individual functions (e.g., mark statistics as favourites, set
statistic alerts) please log in with your personal account.
If you are an admin, please authenticate by logging in again.
Learn more about how Statista can support your business.
Nielsen. (September 7, 2018). Sugar substitute sales value growth in United States as of 2018, by type [Graph]. In Statista. Retrieved June 27, 2025, from https://www.statista.com/statistics/330263/us-supermarkets-sugar-substitutes-dollar-sales/
Nielsen. "Sugar substitute sales value growth in United States as of 2018, by type ." Chart. September 7, 2018. Statista. Accessed June 27, 2025. https://www.statista.com/statistics/330263/us-supermarkets-sugar-substitutes-dollar-sales/
Nielsen. (2018). Sugar substitute sales value growth in United States as of 2018, by type . Statista. Statista Inc.. Accessed: June 27, 2025. https://www.statista.com/statistics/330263/us-supermarkets-sugar-substitutes-dollar-sales/
Nielsen. "Sugar Substitute Sales Value Growth in United States as of 2018, by Type ." Statista, Statista Inc., 7 Sep 2018, https://www.statista.com/statistics/330263/us-supermarkets-sugar-substitutes-dollar-sales/
Nielsen, Sugar substitute sales value growth in United States as of 2018, by type Statista, https://www.statista.com/statistics/330263/us-supermarkets-sugar-substitutes-dollar-sales/ (last visited June 27, 2025)
Sugar substitute sales value growth in United States as of 2018, by type [Graph], Nielsen, September 7, 2018. [Online]. Available: https://www.statista.com/statistics/330263/us-supermarkets-sugar-substitutes-dollar-sales/