This statistic displays the top preferences in the United States for mobile healthcare applications by type as of 2012. During this time, 23 percent of respondents stated to use mhealth apps mainly to provide access to health magazines, blogs, Facebook pages, and others. Men were more likely than women to state that they had no need to use mobile health applications. There has been a slow adoption of mobile health apps in the United States market.
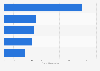
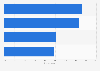
Top preferences for health apps in the United States in 2012
Characteristic
Percentage of respondents
Healthy eating apps
49%
Firtness/training apps
48%
Calorie counter apps
48%
Nutrition apps
46%
General health and lifestyle information apps
41%
Apps to access health magazines, blogs, Facebook pages, etc.
23%
Apps that provide advice/support on long-term medical conditions such as diabetes, asthma, IBS, etc.
13%
Sleep aids/sleep monitoring apps
10%
Medication reminder apps
9%
Apps to help educate children on health
9%
Private medical provider apps
7%
Other health and lifestyle information apps (e.g. alcohol intake monitoring)
4%
Apps that provide smoking cessation support tools
1%
0%5%10%15%20%25%30%35%40%45%50%55%
Add this content to your personal favorites. These can be accessed from the favorites menu in the main navigation.
You have no right to use this feature.
Make sure to contact us if you are interested in scientific citation.
You can upgrade your account to enable this functionality for all statistics.
This feature is not available with your current account.Request access
Learn more about how Statista can support your business.
Ruder Finn. (December 28, 2012). Top preferences for health apps in the United States in 2012 [Graph]. In Statista. Retrieved June 04, 2025, from https://www.statista.com/statistics/348731/preferences-for-health-apps-by-type-in-the-us/
Ruder Finn. "Top preferences for health apps in the United States in 2012." Chart. December 28, 2012. Statista. Accessed June 04, 2025. https://www.statista.com/statistics/348731/preferences-for-health-apps-by-type-in-the-us/
Ruder Finn. (2012). Top preferences for health apps in the United States in 2012. Statista. Statista Inc.. Accessed: June 04, 2025. https://www.statista.com/statistics/348731/preferences-for-health-apps-by-type-in-the-us/
Ruder Finn. "Top Preferences for Health Apps in The United States in 2012." Statista, Statista Inc., 28 Dec 2012, https://www.statista.com/statistics/348731/preferences-for-health-apps-by-type-in-the-us/
Ruder Finn, Top preferences for health apps in the United States in 2012 Statista, https://www.statista.com/statistics/348731/preferences-for-health-apps-by-type-in-the-us/ (last visited June 04, 2025)
Top preferences for health apps in the United States in 2012 [Graph], Ruder Finn, December 28, 2012. [Online]. Available: https://www.statista.com/statistics/348731/preferences-for-health-apps-by-type-in-the-us/
Profit from additional features with an Employee Account
Please create an employee account to be able to mark statistics as favorites.
Then you can access your favorite statistics via the star in the header.
Profit from the additional features of your individual account
Currently, you are using a shared account. To use individual functions (e.g., mark statistics as favourites, set
statistic alerts) please log in with your personal account.
If you are an admin, please authenticate by logging in again.