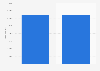
In 2023, about 15 million people were full-time employees of state and local governments in the United States. In the same year, about four million people were part-time employees of state and local governments.
Advertisement
Advertisement
Number of state and local government employees in the United States from 1997 to 2023, by full-time/part-time status
(in millions)
Values are as of March each year, and have been rounded. Full-time employees are defined to include those persons whose hours of work represent full-time employment in their employing government. Part-time employees are defined as persons who work less than the standard number of hours for full-time work in their employing government. Values prior to 2023 taken from here.
Profit from the additional features of your individual account
Currently, you are using a shared account. To use individual functions (e.g., mark statistics as favourites, set
statistic alerts) please log in with your personal account.
If you are an admin, please authenticate by logging in again.
Learn more about how Statista can support your business.
US Census Bureau. (July 3, 2024). Number of state and local government employees in the United States from 1997 to 2023, by full-time/part-time status (in millions) [Graph]. In Statista. Retrieved June 27, 2025, from https://www.statista.com/statistics/365350/us-state-local-government-employees-full-time-part-time-status/
US Census Bureau. "Number of state and local government employees in the United States from 1997 to 2023, by full-time/part-time status (in millions)." Chart. July 3, 2024. Statista. Accessed June 27, 2025. https://www.statista.com/statistics/365350/us-state-local-government-employees-full-time-part-time-status/
US Census Bureau. (2024). Number of state and local government employees in the United States from 1997 to 2023, by full-time/part-time status (in millions). Statista. Statista Inc.. Accessed: June 27, 2025. https://www.statista.com/statistics/365350/us-state-local-government-employees-full-time-part-time-status/
US Census Bureau. "Number of State and Local Government Employees in The United States from 1997 to 2023, by Full-time/Part-time Status (in Millions)." Statista, Statista Inc., 3 Jul 2024, https://www.statista.com/statistics/365350/us-state-local-government-employees-full-time-part-time-status/
US Census Bureau, Number of state and local government employees in the United States from 1997 to 2023, by full-time/part-time status (in millions) Statista, https://www.statista.com/statistics/365350/us-state-local-government-employees-full-time-part-time-status/ (last visited June 27, 2025)
Number of state and local government employees in the United States from 1997 to 2023, by full-time/part-time status (in millions) [Graph], US Census Bureau, July 3, 2024. [Online]. Available: https://www.statista.com/statistics/365350/us-state-local-government-employees-full-time-part-time-status/