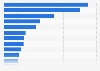
In 2021, the number of enterprises in the tea and coffee manufacturing industry in Portugal increased by 11 enterprises (+14.29 percent) since 2020. With 88 enterprises, the number of enterprises thereby reached its highest value in the observed period. In accordance with EU REGULATION (EC) No 250/2009 only companies are included here which were active during at least a part of the reference period. It also includes local units (branches) which do not constitute a separate legal entity and which are dependent on foreign enterprises.
You have no right to use this feature.
Make sure to contact us if you are interested in scientific citation.
You can upgrade your account to enable this functionality for all statistics.
This feature is not available with your current account.Request access
b: Break in time series. Structural business statistics (SBS) describes the structure, conduct and performance of economic activities, down to the most detailed activity level (several hundred economic sectors). Number of enterprises: a count of the number of enterprises active during at least a part of the reference period. Data coverage corresponds to code C1083 of CE Rev 2.
Learn more about how Statista can support your business.
Eurostat. (March 22, 2024). Number of enterprises in the processing of tea and coffee industry in Portugal from 2012 to 2021 [Graph]. In Statista. Retrieved May 06, 2025, from https://www.statista.com/statistics/368057/number-of-enterprises-in-the-processing-of-tea-and-coffee-sector-in-portugal/
Eurostat. "Number of enterprises in the processing of tea and coffee industry in Portugal from 2012 to 2021." Chart. March 22, 2024. Statista. Accessed May 06, 2025. https://www.statista.com/statistics/368057/number-of-enterprises-in-the-processing-of-tea-and-coffee-sector-in-portugal/
Eurostat. (2024). Number of enterprises in the processing of tea and coffee industry in Portugal from 2012 to 2021. Statista. Statista Inc.. Accessed: May 06, 2025. https://www.statista.com/statistics/368057/number-of-enterprises-in-the-processing-of-tea-and-coffee-sector-in-portugal/
Eurostat. "Number of Enterprises in The Processing of Tea and Coffee Industry in Portugal from 2012 to 2021." Statista, Statista Inc., 22 Mar 2024, https://www.statista.com/statistics/368057/number-of-enterprises-in-the-processing-of-tea-and-coffee-sector-in-portugal/
Eurostat, Number of enterprises in the processing of tea and coffee industry in Portugal from 2012 to 2021 Statista, https://www.statista.com/statistics/368057/number-of-enterprises-in-the-processing-of-tea-and-coffee-sector-in-portugal/ (last visited May 06, 2025)
Number of enterprises in the processing of tea and coffee industry in Portugal from 2012 to 2021 [Graph], Eurostat, March 22, 2024. [Online]. Available: https://www.statista.com/statistics/368057/number-of-enterprises-in-the-processing-of-tea-and-coffee-sector-in-portugal/
Profit from additional features with an Employee Account
Please create an employee account to be able to mark statistics as favorites.
Then you can access your favorite statistics via the star in the header.
Profit from the additional features of your individual account
Currently, you are using a shared account. To use individual functions (e.g., mark statistics as favourites, set
statistic alerts) please log in with your personal account.
If you are an admin, please authenticate by logging in again.