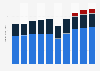
This statistic shows the number of restaurants in the United States from 2012 to 2018, by type. In Spring 2018, there were 307,940 chain restaurants and 352,815 independent restaurants in the United States.
Number of restaurants in the United States from 2012 to 2018, by type
Profit from the additional features of your individual account
Currently, you are using a shared account. To use individual functions (e.g., mark statistics as favourites, set
statistic alerts) please log in with your personal account.
If you are an admin, please authenticate by logging in again.
Learn more about how Statista can support your business.
NPD Group. (August 22, 2018). Number of restaurants in the United States from 2012 to 2018, by type [Graph]. In Statista. Retrieved May 08, 2025, from https://www.statista.com/statistics/374866/number-of-restaurants-by-type-us/
NPD Group. "Number of restaurants in the United States from 2012 to 2018, by type." Chart. August 22, 2018. Statista. Accessed May 08, 2025. https://www.statista.com/statistics/374866/number-of-restaurants-by-type-us/
NPD Group. (2018). Number of restaurants in the United States from 2012 to 2018, by type. Statista. Statista Inc.. Accessed: May 08, 2025. https://www.statista.com/statistics/374866/number-of-restaurants-by-type-us/
NPD Group. "Number of Restaurants in The United States from 2012 to 2018, by Type." Statista, Statista Inc., 22 Aug 2018, https://www.statista.com/statistics/374866/number-of-restaurants-by-type-us/
NPD Group, Number of restaurants in the United States from 2012 to 2018, by type Statista, https://www.statista.com/statistics/374866/number-of-restaurants-by-type-us/ (last visited May 08, 2025)
Number of restaurants in the United States from 2012 to 2018, by type [Graph], NPD Group, August 22, 2018. [Online]. Available: https://www.statista.com/statistics/374866/number-of-restaurants-by-type-us/