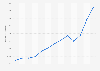
In 2023, the number of enterprises in the chemicals and chemical products manufacturing industry in Poland was about 3.09 thousand. Between 2021 and 2023, the number of enterprises dropped by approximately 20.
Advertisement
Advertisement
Number of chemicals and chemical products manufacturing firms in Poland from 2021 to 2023
(in 1,000s)
Characteristic
Number of chemicals and chemical products manufacturing firms in thousands
Profit from the additional features of your individual account
Currently, you are using a shared account. To use individual functions (e.g., mark statistics as favourites, set
statistic alerts) please log in with your personal account.
If you are an admin, please authenticate by logging in again.
Learn more about how Statista can support your business.
Eurostat. (May 7, 2025). Number of chemicals and chemical products manufacturing firms in Poland from 2021 to 2023 (in 1,000s) [Graph]. In Statista. Retrieved June 29, 2025, from https://www.statista.com/statistics/375341/number-of-enterprises-in-the-manufacture-of-chemicals-sector-in-poland/
Eurostat. "Number of chemicals and chemical products manufacturing firms in Poland from 2021 to 2023 (in 1,000s)." Chart. May 7, 2025. Statista. Accessed June 29, 2025. https://www.statista.com/statistics/375341/number-of-enterprises-in-the-manufacture-of-chemicals-sector-in-poland/
Eurostat. (2025). Number of chemicals and chemical products manufacturing firms in Poland from 2021 to 2023 (in 1,000s). Statista. Statista Inc.. Accessed: June 29, 2025. https://www.statista.com/statistics/375341/number-of-enterprises-in-the-manufacture-of-chemicals-sector-in-poland/
Eurostat. "Number of Chemicals and Chemical Products Manufacturing Firms in Poland from 2021 to 2023 (in 1,000s)." Statista, Statista Inc., 7 May 2025, https://www.statista.com/statistics/375341/number-of-enterprises-in-the-manufacture-of-chemicals-sector-in-poland/
Eurostat, Number of chemicals and chemical products manufacturing firms in Poland from 2021 to 2023 (in 1,000s) Statista, https://www.statista.com/statistics/375341/number-of-enterprises-in-the-manufacture-of-chemicals-sector-in-poland/ (last visited June 29, 2025)
Number of chemicals and chemical products manufacturing firms in Poland from 2021 to 2023 (in 1,000s) [Graph], Eurostat, May 7, 2025. [Online]. Available: https://www.statista.com/statistics/375341/number-of-enterprises-in-the-manufacture-of-chemicals-sector-in-poland/