The number of enterprises in the plastics in primary forms manufacturing industry in the Netherlands increased by five enterprises (+3.4 percent) since the previous year. In total, the number of enterprises amounted to 152 enterprises in 2021. Only active units which either had turnover or employment at any time during the reference period should be included.
Find more key insights for the number of enterprises in countries like Belgium and Luxembourg.
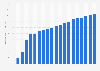
Number of enterprises in the manufacture of plastics in primary forms industry in the Netherlands from 2010 to 2021
Characteristic
Number of enterprises
2021
152
2020
147
2019
146
2018
157
2017
141
2016
139
2015
137
2014
134
2013
136
2012
137
2011
133
2010
133
0255075100125150175
Add this content to your personal favorites. These can be accessed from the favorites menu in the main navigation.
You have no right to use this feature.
Make sure to contact us if you are interested in scientific citation.
You can upgrade your account to enable this functionality for all statistics.
This feature is not available with your current account.Request access
Structural business statistics (SBS) describes the structure, conduct and performance of economic activities, down to the most detailed activity level (several hundred economic sectors). Number of enterprises: a count of the number of enterprises active during at least a part of the reference period. Data coverage corresponds to Section C2016 of CE Rev 2.
Learn more about how Statista can support your business.
Eurostat. (March 22, 2024). Number of enterprises in the manufacture of plastics in primary forms industry in the Netherlands from 2010 to 2021 [Graph]. In Statista. Retrieved June 11, 2025, from https://www.statista.com/statistics/375484/number-of-enterprises-in-the-manufacture-of-plastics-in-primary-form-in-the-netherlands/
Eurostat. "Number of enterprises in the manufacture of plastics in primary forms industry in the Netherlands from 2010 to 2021." Chart. March 22, 2024. Statista. Accessed June 11, 2025. https://www.statista.com/statistics/375484/number-of-enterprises-in-the-manufacture-of-plastics-in-primary-form-in-the-netherlands/
Eurostat. (2024). Number of enterprises in the manufacture of plastics in primary forms industry in the Netherlands from 2010 to 2021. Statista. Statista Inc.. Accessed: June 11, 2025. https://www.statista.com/statistics/375484/number-of-enterprises-in-the-manufacture-of-plastics-in-primary-form-in-the-netherlands/
Eurostat. "Number of Enterprises in The Manufacture of Plastics in Primary Forms Industry in The Netherlands from 2010 to 2021." Statista, Statista Inc., 22 Mar 2024, https://www.statista.com/statistics/375484/number-of-enterprises-in-the-manufacture-of-plastics-in-primary-form-in-the-netherlands/
Eurostat, Number of enterprises in the manufacture of plastics in primary forms industry in the Netherlands from 2010 to 2021 Statista, https://www.statista.com/statistics/375484/number-of-enterprises-in-the-manufacture-of-plastics-in-primary-form-in-the-netherlands/ (last visited June 11, 2025)
Number of enterprises in the manufacture of plastics in primary forms industry in the Netherlands from 2010 to 2021 [Graph], Eurostat, March 22, 2024. [Online]. Available: https://www.statista.com/statistics/375484/number-of-enterprises-in-the-manufacture-of-plastics-in-primary-form-in-the-netherlands/
Profit from additional features with an Employee Account
Please create an employee account to be able to mark statistics as favorites.
Then you can access your favorite statistics via the star in the header.
Profit from the additional features of your individual account
Currently, you are using a shared account. To use individual functions (e.g., mark statistics as favourites, set
statistic alerts) please log in with your personal account.
If you are an admin, please authenticate by logging in again.