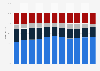
In 2024, Roche's Pharmaceuticals division (the company’s larger segment) reported a sales value of **** billion Swiss francs, while the Diagnostics division generated some **** billion Swiss francs.
The Roche Group
The Roche Group, which is also known as F. Hoffmann-La Roche AG, is a Swiss-based pharmaceutical company with subsidiaries, such as Genetech, Spark Therapeutics, and Kapa Biosystems (Pty) Ltd. In 2024, the multinational enterprise generated **** billion Swiss francs’ worth of total sales. Alongside each division, the Roche Group’s sales numbers have also been increasing recently, however, 2023 saw a significant decrease of around *** billion francs. The company’s workforce included over ******* employees in 2024. The largest part of them were employed in Europe, while nearly ****** staff members were active in North America. Since 2011, Roche’s research and development expenditures have been increasing steadily, with a peak of over ** billion Swiss francs in 2022 and 2024.
Profit from the additional features of your individual account
Currently, you are using a shared account. To use individual functions (e.g., mark statistics as favourites, set
statistic alerts) please log in with your personal account.
If you are an admin, please authenticate by logging in again.
Learn more about how Statista can support your business.
Roche. (January 30, 2025). Total sales of the Roche Group from 2013 to 2024, by division (in million Swiss francs) [Graph]. In Statista. Retrieved June 29, 2025, from https://www.statista.com/statistics/382440/roche-group-sales-by-division/
Roche. "Total sales of the Roche Group from 2013 to 2024, by division (in million Swiss francs)." Chart. January 30, 2025. Statista. Accessed June 29, 2025. https://www.statista.com/statistics/382440/roche-group-sales-by-division/
Roche. (2025). Total sales of the Roche Group from 2013 to 2024, by division (in million Swiss francs). Statista. Statista Inc.. Accessed: June 29, 2025. https://www.statista.com/statistics/382440/roche-group-sales-by-division/
Roche. "Total Sales of The Roche Group from 2013 to 2024, by Division (in Million Swiss Francs)." Statista, Statista Inc., 30 Jan 2025, https://www.statista.com/statistics/382440/roche-group-sales-by-division/
Roche, Total sales of the Roche Group from 2013 to 2024, by division (in million Swiss francs) Statista, https://www.statista.com/statistics/382440/roche-group-sales-by-division/ (last visited June 29, 2025)
Total sales of the Roche Group from 2013 to 2024, by division (in million Swiss francs) [Graph], Roche, January 30, 2025. [Online]. Available: https://www.statista.com/statistics/382440/roche-group-sales-by-division/