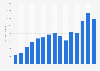
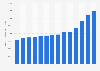
Most Bentley cars are manufactured in Great Britain although the brand is a wholly owned subsidiary of German Volkswagen AG. Bentley experienced the highest decline in sales revenue in 2009, at 47.3 percent. In 2010 and 2011, Bentley sales revenue increased, with the highest growth of 55.3 percent recorded in 2011. The brand saw sales revenue fall by around 13.2 percent in the 2023 fiscal year.
Advertisement
Advertisement
Year-over-year growth rate in the global sales revenue of Bentley Motors from FY 2009 to FY 2023
Profit from the additional features of your individual account
Currently, you are using a shared account. To use individual functions (e.g., mark statistics as favourites, set
statistic alerts) please log in with your personal account.
If you are an admin, please authenticate by logging in again.
Learn more about how Statista can support your business.
Volkswagen. (March 16, 2024). Year-over-year growth rate in the global sales revenue of Bentley Motors from FY 2009 to FY 2023 [Graph]. In Statista. Retrieved July 06, 2025, from https://www.statista.com/statistics/386423/british-luxury-car-brand-bentley-global-sales-revenue-growth/
Volkswagen. "Year-over-year growth rate in the global sales revenue of Bentley Motors from FY 2009 to FY 2023." Chart. March 16, 2024. Statista. Accessed July 06, 2025. https://www.statista.com/statistics/386423/british-luxury-car-brand-bentley-global-sales-revenue-growth/
Volkswagen. (2024). Year-over-year growth rate in the global sales revenue of Bentley Motors from FY 2009 to FY 2023. Statista. Statista Inc.. Accessed: July 06, 2025. https://www.statista.com/statistics/386423/british-luxury-car-brand-bentley-global-sales-revenue-growth/
Volkswagen. "Year-over-year Growth Rate in The Global Sales Revenue of Bentley Motors from Fy 2009 to Fy 2023." Statista, Statista Inc., 16 Mar 2024, https://www.statista.com/statistics/386423/british-luxury-car-brand-bentley-global-sales-revenue-growth/
Volkswagen, Year-over-year growth rate in the global sales revenue of Bentley Motors from FY 2009 to FY 2023 Statista, https://www.statista.com/statistics/386423/british-luxury-car-brand-bentley-global-sales-revenue-growth/ (last visited July 06, 2025)
Year-over-year growth rate in the global sales revenue of Bentley Motors from FY 2009 to FY 2023 [Graph], Volkswagen, March 16, 2024. [Online]. Available: https://www.statista.com/statistics/386423/british-luxury-car-brand-bentley-global-sales-revenue-growth/