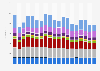
In 2023, the annual greenhouse gas emissions of the energy sector in Latvia were approximately 6.39 million tons. Between 1990 and 2023, the figure dropped by around 13.14 million tons, though the decline followed an uneven course rather than a steady trajectory.
Advertisement
Advertisement
Energy sector greenhouse gas emissions in Latvia from 1990 to 2023
(in millions)
Characteristic
Energy sector greenhouse gas emissions in million tons
2023
6.39
2022
6.41
2021
7.02
2020
6.8
2019
7.46
2018
7.69
2017
7.26
2016
7.27
2015
7.2
2014
7.09
2013
7.27
2012
7.34
2011
7.66
0510152025
Add this content to your personal favorites. These can be accessed from the favorites menu in the main navigation.
You have no right to use this feature.
Make sure to contact us if you are interested in scientific citation.
You can upgrade your account to enable this functionality for all statistics.
This feature is not available with your current account.Request access
Learn more about how Statista can support your business.
Eurostat. (May 8, 2025). Energy sector greenhouse gas emissions in Latvia from 1990 to 2023 (in millions) [Graph]. In Statista. Retrieved July 13, 2025, from https://www.statista.com/statistics/411706/annual-greenhouse-gas-emissions-of-the-energy-sector-in-latvia/
Eurostat. "Energy sector greenhouse gas emissions in Latvia from 1990 to 2023 (in millions)." Chart. May 8, 2025. Statista. Accessed July 13, 2025. https://www.statista.com/statistics/411706/annual-greenhouse-gas-emissions-of-the-energy-sector-in-latvia/
Eurostat. (2025). Energy sector greenhouse gas emissions in Latvia from 1990 to 2023 (in millions). Statista. Statista Inc.. Accessed: July 13, 2025. https://www.statista.com/statistics/411706/annual-greenhouse-gas-emissions-of-the-energy-sector-in-latvia/
Eurostat. "Energy Sector Greenhouse Gas Emissions in Latvia from 1990 to 2023 (in Millions)." Statista, Statista Inc., 8 May 2025, https://www.statista.com/statistics/411706/annual-greenhouse-gas-emissions-of-the-energy-sector-in-latvia/
Eurostat, Energy sector greenhouse gas emissions in Latvia from 1990 to 2023 (in millions) Statista, https://www.statista.com/statistics/411706/annual-greenhouse-gas-emissions-of-the-energy-sector-in-latvia/ (last visited July 13, 2025)
Energy sector greenhouse gas emissions in Latvia from 1990 to 2023 (in millions) [Graph], Eurostat, May 8, 2025. [Online]. Available: https://www.statista.com/statistics/411706/annual-greenhouse-gas-emissions-of-the-energy-sector-in-latvia/
Advertisement
Profit from additional features with an Employee Account
Please create an employee account to be able to mark statistics as favorites.
Then you can access your favorite statistics via the star in the header.
Profit from the additional features of your individual account
Currently, you are using a shared account. To use individual functions (e.g., mark statistics as favourites, set
statistic alerts) please log in with your personal account.
If you are an admin, please authenticate by logging in again.