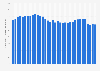
The annual greenhouse gas emissions in the industrial processing sector in Austria were approximately 15.47 million tons in 2023. Between 1990 and 2023, the emissions rose by around 1.83 million tons, though the increase followed an uneven trajectory rather than a consistent upward trend.
Advertisement
Advertisement
Industrial processing greenhouse gas emissions in Austria from 1990 to 2023
(in millions)
Characteristic
Industrial processing greenhouse gas emissions in million tons
2023
15.47
2022
16.17
2021
17.03
2020
15.52
2019
16.47
2018
15.5
2017
17.08
2016
16.32
2015
16.61
2014
16.17
2013
16.1
2012
15.73
2011
16.16
02.557.51012.51517.520
Add this content to your personal favorites. These can be accessed from the favorites menu in the main navigation.
You have no right to use this feature.
Make sure to contact us if you are interested in scientific citation.
You can upgrade your account to enable this functionality for all statistics.
This feature is not available with your current account.Request access
Learn more about how Statista can support your business.
Eurostat. (May 8, 2025). Industrial processing greenhouse gas emissions in Austria from 1990 to 2023 (in millions) [Graph]. In Statista. Retrieved July 06, 2025, from https://www.statista.com/statistics/412186/annual-greenhouse-gas-emissions-from-industrial-processing-in-austria/
Eurostat. "Industrial processing greenhouse gas emissions in Austria from 1990 to 2023 (in millions)." Chart. May 8, 2025. Statista. Accessed July 06, 2025. https://www.statista.com/statistics/412186/annual-greenhouse-gas-emissions-from-industrial-processing-in-austria/
Eurostat. (2025). Industrial processing greenhouse gas emissions in Austria from 1990 to 2023 (in millions). Statista. Statista Inc.. Accessed: July 06, 2025. https://www.statista.com/statistics/412186/annual-greenhouse-gas-emissions-from-industrial-processing-in-austria/
Eurostat. "Industrial Processing Greenhouse Gas Emissions in Austria from 1990 to 2023 (in Millions)." Statista, Statista Inc., 8 May 2025, https://www.statista.com/statistics/412186/annual-greenhouse-gas-emissions-from-industrial-processing-in-austria/
Eurostat, Industrial processing greenhouse gas emissions in Austria from 1990 to 2023 (in millions) Statista, https://www.statista.com/statistics/412186/annual-greenhouse-gas-emissions-from-industrial-processing-in-austria/ (last visited July 06, 2025)
Industrial processing greenhouse gas emissions in Austria from 1990 to 2023 (in millions) [Graph], Eurostat, May 8, 2025. [Online]. Available: https://www.statista.com/statistics/412186/annual-greenhouse-gas-emissions-from-industrial-processing-in-austria/
Advertisement
Profit from additional features with an Employee Account
Please create an employee account to be able to mark statistics as favorites.
Then you can access your favorite statistics via the star in the header.
Profit from the additional features of your individual account
Currently, you are using a shared account. To use individual functions (e.g., mark statistics as favourites, set
statistic alerts) please log in with your personal account.
If you are an admin, please authenticate by logging in again.