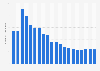
The return on tangible equity ratio (ROTE) of the NatWest Group fluctuated considerably between 2012 and 2024. The lowest ROTE ratio was recorded in 2013 at negative 18.7 percent, indicating reduced efficiency of the group in terms of capital allocation. In contrast, the peak ratio during this period was reached in 2023 at around 17.8 percent. The NatWest Group was called Royal Bank of Scotland until 2020, when it was renamed after the brand under which the majority of its business was delivered.
Advertisement
Advertisement
Return on tangible equity (ROTE) of the NatWest Group from 2012 to 2024
Profit from the additional features of your individual account
Currently, you are using a shared account. To use individual functions (e.g., mark statistics as favourites, set
statistic alerts) please log in with your personal account.
If you are an admin, please authenticate by logging in again.
Learn more about how Statista can support your business.
NatWest Group. (February 14, 2025). Return on tangible equity (ROTE) of the NatWest Group from 2012 to 2024 [Graph]. In Statista. Retrieved June 26, 2025, from https://www.statista.com/statistics/421360/equity-return-performance-ratio-the-royal-bank-of-scotland/
NatWest Group. "Return on tangible equity (ROTE) of the NatWest Group from 2012 to 2024." Chart. February 14, 2025. Statista. Accessed June 26, 2025. https://www.statista.com/statistics/421360/equity-return-performance-ratio-the-royal-bank-of-scotland/
NatWest Group. (2025). Return on tangible equity (ROTE) of the NatWest Group from 2012 to 2024. Statista. Statista Inc.. Accessed: June 26, 2025. https://www.statista.com/statistics/421360/equity-return-performance-ratio-the-royal-bank-of-scotland/
NatWest Group. "Return on Tangible Equity (Rote) of The Natwest Group from 2012 to 2024." Statista, Statista Inc., 14 Feb 2025, https://www.statista.com/statistics/421360/equity-return-performance-ratio-the-royal-bank-of-scotland/
NatWest Group, Return on tangible equity (ROTE) of the NatWest Group from 2012 to 2024 Statista, https://www.statista.com/statistics/421360/equity-return-performance-ratio-the-royal-bank-of-scotland/ (last visited June 26, 2025)
Return on tangible equity (ROTE) of the NatWest Group from 2012 to 2024 [Graph], NatWest Group, February 14, 2025. [Online]. Available: https://www.statista.com/statistics/421360/equity-return-performance-ratio-the-royal-bank-of-scotland/