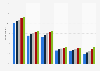
The media landscape in the EU has changed over recent years, mainly due to the widespread increase in the availability and use of the internet. The share of people in the countries of the European Union who watched television on a TV set, listened to the radio, and read the written press every day has declined, while the number of people who used the internet and watched TV via the internet daily has grown. Whereas the number of people using social networks daily has grown overall since 2011, the survey of 2023 found an increase of ***** percentage points in daily users, compared to the previous year.
Trust in media
As media use changes, so have attitudes towards different media types. Levels of trust in media seem to have decreased, with online social media deemed particularly untrustworthy throughout the European Union. Traditional media is still regarded as the most credible source for news.
Pressing times for print media
With online media doing so well, it has been a difficult decade for print media. Newspapers and magazines have suffered, with sales dropping substantially. This has had a knock-on effect on advertising revenue.
* n (2012) = 26,622, n (2013) = 27,829, n (2014) = 27,901, n (2015) = 27,681, n (2016) = 27,705, n (2017) = 28,055, n (2018) = 27,424, n(2019) = 27,382, n (2020/2021): 27,409, n(2022) = 26,696. n(2023) = 26,468 ** Dates of survey: November 2011, November 3-18, 2012, November 2-17, 2013, November 8-17, 2014, November 7-17, 2015, November 3-16, 2016, November 5-19, 2017, November 8-22, 2018, November 14-29, 2019, February 12 to March 11, 2021, January 18 to February 14, 2022. January 12 to February 23, 2023. This statistic only shows the share of respondents that replied, "Every day/almost every day". Figures preceding 2023 were retrieved from earlier publications.
As of the survey of 2022, the data was gathered within the EU- 27 countries, without the United Kingdom.
Profit from the additional features of your individual account
Currently, you are using a shared account. To use individual functions (e.g., mark statistics as favourites, set
statistic alerts) please log in with your personal account.
If you are an admin, please authenticate by logging in again.
Learn more about how Statista can support your business.
European Commission. (February 22, 2023). Share of respondents who used the following media every day or almost every day in the European Union from 2011 to 2023 [Graph]. In Statista. Retrieved June 24, 2025, from https://www.statista.com/statistics/422572/europe-daily-media-usage/
European Commission. "Share of respondents who used the following media every day or almost every day in the European Union from 2011 to 2023." Chart. February 22, 2023. Statista. Accessed June 24, 2025. https://www.statista.com/statistics/422572/europe-daily-media-usage/
European Commission. (2023). Share of respondents who used the following media every day or almost every day in the European Union from 2011 to 2023. Statista. Statista Inc.. Accessed: June 24, 2025. https://www.statista.com/statistics/422572/europe-daily-media-usage/
European Commission. "Share of Respondents Who Used The following Media Every Day or Almost Every Day in The European Union from 2011 to 2023." Statista, Statista Inc., 22 Feb 2023, https://www.statista.com/statistics/422572/europe-daily-media-usage/
European Commission, Share of respondents who used the following media every day or almost every day in the European Union from 2011 to 2023 Statista, https://www.statista.com/statistics/422572/europe-daily-media-usage/ (last visited June 24, 2025)
Share of respondents who used the following media every day or almost every day in the European Union from 2011 to 2023 [Graph], European Commission, February 22, 2023. [Online]. Available: https://www.statista.com/statistics/422572/europe-daily-media-usage/