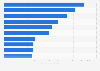
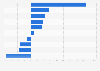
This statistic displays the pharmaceutical sales for patented and non-patented drugs in Canada from 2004 to 2023. In 2007, patented drug sales in the country totaled 12.1 billion Canadian dollars, while the record high was in 2023 with nearly 20 billion Canadian dollars. 2022 was the year when non-patented drug sales were higher for the first time in the provided period. The pharmaceutical industry in Canada both develops and manufactures brand name and generic pharmaceuticals.
Advertisement
Advertisement
Pharmaceutical sales from patented and non-patented drugs in Canada from 2004 to 2023
(in billion Canadian dollars)
Characteristic
Patented
Non-patented
2023*
19.9
21.1
2022*
18.4
19.2
2021*
17.4
16.7
2020*
17.7
14.2
2019*
17.2
12.7
2018*
16.7
11.6
2017
16.8
10.2
2016
15.6
10
2015
15.1
9.4
2014
13.8
9.2
2013
13.4
8.7
2012
12.9
8.9
2011
12.9
9.2
0510152025
Add this content to your personal favorites. These can be accessed from the favorites menu in the main navigation.
You have no right to use this feature.
Make sure to contact us if you are interested in scientific citation.
You can upgrade your account to enable this functionality for all statistics.
This feature is not available with your current account.Request access
Learn more about how Statista can support your business.
PMPRB. (December 6, 2024). Pharmaceutical sales from patented and non-patented drugs in Canada from 2004 to 2023 (in billion Canadian dollars) [Graph]. In Statista. Retrieved July 15, 2025, from https://www.statista.com/statistics/422591/sales-from-patented-and-non-patented-pharmaceutical-drugs-in-canada/
PMPRB. "Pharmaceutical sales from patented and non-patented drugs in Canada from 2004 to 2023 (in billion Canadian dollars)." Chart. December 6, 2024. Statista. Accessed July 15, 2025. https://www.statista.com/statistics/422591/sales-from-patented-and-non-patented-pharmaceutical-drugs-in-canada/
PMPRB. (2024). Pharmaceutical sales from patented and non-patented drugs in Canada from 2004 to 2023 (in billion Canadian dollars). Statista. Statista Inc.. Accessed: July 15, 2025. https://www.statista.com/statistics/422591/sales-from-patented-and-non-patented-pharmaceutical-drugs-in-canada/
PMPRB. "Pharmaceutical Sales from Patented and Non-patented Drugs in Canada from 2004 to 2023 (in Billion Canadian Dollars)." Statista, Statista Inc., 6 Dec 2024, https://www.statista.com/statistics/422591/sales-from-patented-and-non-patented-pharmaceutical-drugs-in-canada/
PMPRB, Pharmaceutical sales from patented and non-patented drugs in Canada from 2004 to 2023 (in billion Canadian dollars) Statista, https://www.statista.com/statistics/422591/sales-from-patented-and-non-patented-pharmaceutical-drugs-in-canada/ (last visited July 15, 2025)
Pharmaceutical sales from patented and non-patented drugs in Canada from 2004 to 2023 (in billion Canadian dollars) [Graph], PMPRB, December 6, 2024. [Online]. Available: https://www.statista.com/statistics/422591/sales-from-patented-and-non-patented-pharmaceutical-drugs-in-canada/
Advertisement
Profit from additional features with an Employee Account
Please create an employee account to be able to mark statistics as favorites.
Then you can access your favorite statistics via the star in the header.
Profit from the additional features of your individual account
Currently, you are using a shared account. To use individual functions (e.g., mark statistics as favourites, set
statistic alerts) please log in with your personal account.
If you are an admin, please authenticate by logging in again.