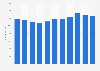
In 2024, Inner Mongolia Yili Industrial Group Co., Ltd., Asia’s leading dairy company, generated a total revenue of around ***** billion yuan. This was a revenue decrease of over *** percent compared to the previous year. The fiscal year end of the company is December 31st.
Dairy industry in China
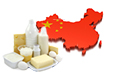
The Chinese dairy industry produces approximately ** million metric tons of cow’s milk per year. While the number of dairy cows is projected to see a slight growth in the coming years, the productivity per cow as well as milk quality is expected to continue to improve. Privatization regulations, dairy corporate support and dairy farm expansion are among state priorities that help to boost the dairy market in China. The traditional dairy-free Chinese diet has been changing, and milk products are becoming a daily norm, especially in the northwest region and major cities across the country. In 2024, the retail sales value of dairy products is estimated to reach around *** billion yuan.
Yili Group
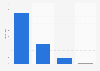
Yili Group is the largest dairy processor in China, established in 1993 and headquartered in Hohhot, the provincial capital of Inner Mongolia. It’s a state-controlled enterprise listed on the Shanghai Stock Exchange. The largest share of the company’s revenue comes from liquid milk production. Other products include milk powder, yogurt, ice cream, and raw milk. As of 2024, Yili Group generated a gross profit of around ***** billion yuan and owned total assets of around ***** billion yuan.
Profit from the additional features of your individual account
Currently, you are using a shared account. To use individual functions (e.g., mark statistics as favourites, set
statistic alerts) please log in with your personal account.
If you are an admin, please authenticate by logging in again.
Learn more about how Statista can support your business.
Yili Group, & Sina.com.cn. (April 30, 2025). Revenue of Inner Mongolia Yili Industrial Group from 2014 to 2024 (in billion yuan) [Graph]. In Statista. Retrieved July 13, 2025, from https://www.statista.com/statistics/423009/revenue-of-inner-mongolia-yili-industrial-group/
Yili Group, und Sina.com.cn. "Revenue of Inner Mongolia Yili Industrial Group from 2014 to 2024 (in billion yuan)." Chart. April 30, 2025. Statista. Accessed July 13, 2025. https://www.statista.com/statistics/423009/revenue-of-inner-mongolia-yili-industrial-group/
Yili Group, Sina.com.cn. (2025). Revenue of Inner Mongolia Yili Industrial Group from 2014 to 2024 (in billion yuan). Statista. Statista Inc.. Accessed: July 13, 2025. https://www.statista.com/statistics/423009/revenue-of-inner-mongolia-yili-industrial-group/
Yili Group, and Sina.com.cn. "Revenue of Inner Mongolia Yili Industrial Group from 2014 to 2024 (in Billion Yuan)." Statista, Statista Inc., 30 Apr 2025, https://www.statista.com/statistics/423009/revenue-of-inner-mongolia-yili-industrial-group/
Yili Group & Sina.com.cn, Revenue of Inner Mongolia Yili Industrial Group from 2014 to 2024 (in billion yuan) Statista, https://www.statista.com/statistics/423009/revenue-of-inner-mongolia-yili-industrial-group/ (last visited July 13, 2025)
Revenue of Inner Mongolia Yili Industrial Group from 2014 to 2024 (in billion yuan) [Graph], Yili Group, & Sina.com.cn, April 30, 2025. [Online]. Available: https://www.statista.com/statistics/423009/revenue-of-inner-mongolia-yili-industrial-group/