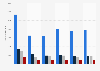
In 2022, about 1.03 percent of people in the United States experienced at least one assault during the past year. In contrast, about 6.65 percent of people experienced a theft in that year, making it the most common type of crime experienced.
Advertisement
Advertisement
Prevalence crime rate in the United States in 2022, by type of crime
Characteristic
Percentage of persons who experienced at least one victimization
Data includes number of persons age 12 or older who experienced at least one victimization during the year for violent crime, and number of households that experienced at least one victimization during the year for property crime.
*'Domestic violence' includes victimization committed by intimate partners and family members.
**'Intimate partner violence' includes victimization committed by current or former spouses, boyfriends, or girlfriends.
More information about the measuring the prevalence of crime can be accessed here.
Profit from the additional features of your individual account
Currently, you are using a shared account. To use individual functions (e.g., mark statistics as favourites, set
statistic alerts) please log in with your personal account.
If you are an admin, please authenticate by logging in again.
Learn more about how Statista can support your business.
US Bureau of Justice Statistics. (September 14, 2023). Prevalence crime rate in the United States in 2022, by type of crime [Graph]. In Statista. Retrieved June 29, 2025, from https://www.statista.com/statistics/423236/prevalence-crime-rate-in-the-united-states-by-type/
US Bureau of Justice Statistics. "Prevalence crime rate in the United States in 2022, by type of crime." Chart. September 14, 2023. Statista. Accessed June 29, 2025. https://www.statista.com/statistics/423236/prevalence-crime-rate-in-the-united-states-by-type/
US Bureau of Justice Statistics. (2023). Prevalence crime rate in the United States in 2022, by type of crime. Statista. Statista Inc.. Accessed: June 29, 2025. https://www.statista.com/statistics/423236/prevalence-crime-rate-in-the-united-states-by-type/
US Bureau of Justice Statistics. "Prevalence Crime Rate in The United States in 2022, by Type of Crime." Statista, Statista Inc., 14 Sep 2023, https://www.statista.com/statistics/423236/prevalence-crime-rate-in-the-united-states-by-type/
US Bureau of Justice Statistics, Prevalence crime rate in the United States in 2022, by type of crime Statista, https://www.statista.com/statistics/423236/prevalence-crime-rate-in-the-united-states-by-type/ (last visited June 29, 2025)
Prevalence crime rate in the United States in 2022, by type of crime [Graph], US Bureau of Justice Statistics, September 14, 2023. [Online]. Available: https://www.statista.com/statistics/423236/prevalence-crime-rate-in-the-united-states-by-type/