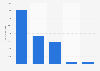
This graph shows the rate of violent and property victimization in the United States for the year 2016 distinguished by household location. In 2016, property crime victimization rate in urban areas stood at 150.5 per 1,000 households compared to 125 per 1,000 households in rural areas.
Advertisement
Advertisement
Rate of violent and property victimization in the U.S. in 2016, by household location
(per 1,000 persons/households)
Victimization rates are per 1,000 persons age 12 or older for 'violent crime' and per 1,000 households for 'property crime'.
'Violent crime' includes rape or sexual assault, robbery, aggravated assault, and simple assault.
'Serious violent crime' includes rape or sexual assault, robbery, and aggravated assault.
'Property crime' includes household burglary, motor vehicle theft, and theft.
Profit from the additional features of your individual account
Currently, you are using a shared account. To use individual functions (e.g., mark statistics as favourites, set
statistic alerts) please log in with your personal account.
If you are an admin, please authenticate by logging in again.
Learn more about how Statista can support your business.
US Bureau of Justice Statistics. (December 31, 2017). Rate of violent and property victimization in the U.S. in 2016, by household location (per 1,000 persons/households) [Graph]. In Statista. Retrieved June 20, 2025, from https://www.statista.com/statistics/424149/us-violent-and-property-victimization-rate-by-household-location/
US Bureau of Justice Statistics. "Rate of violent and property victimization in the U.S. in 2016, by household location (per 1,000 persons/households)." Chart. December 31, 2017. Statista. Accessed June 20, 2025. https://www.statista.com/statistics/424149/us-violent-and-property-victimization-rate-by-household-location/
US Bureau of Justice Statistics. (2017). Rate of violent and property victimization in the U.S. in 2016, by household location (per 1,000 persons/households). Statista. Statista Inc.. Accessed: June 20, 2025. https://www.statista.com/statistics/424149/us-violent-and-property-victimization-rate-by-household-location/
US Bureau of Justice Statistics. "Rate of Violent and Property Victimization in The U.S. in 2016, by Household Location (per 1,000 Persons/Households)." Statista, Statista Inc., 31 Dec 2017, https://www.statista.com/statistics/424149/us-violent-and-property-victimization-rate-by-household-location/
US Bureau of Justice Statistics, Rate of violent and property victimization in the U.S. in 2016, by household location (per 1,000 persons/households) Statista, https://www.statista.com/statistics/424149/us-violent-and-property-victimization-rate-by-household-location/ (last visited June 20, 2025)
Rate of violent and property victimization in the U.S. in 2016, by household location (per 1,000 persons/households) [Graph], US Bureau of Justice Statistics, December 31, 2017. [Online]. Available: https://www.statista.com/statistics/424149/us-violent-and-property-victimization-rate-by-household-location/