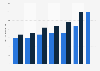
This statistic presents the population of high net worth individuals in selected European countries from 2013 to 2019. "High net worth individuals" (HNWI) in financial services and private wealth management industries signifies persons, whose investible assets (stocks, bonds etc.) exceed a specific given amount. In the case of the underlying report, the threshold minimum defined for these figures was at least one million U.S. dollars in financial assets.
During the period displayed, the number of HNWI's across Europe has seen a general increase. There were approximately 1.47 million high net worth individuals living in Germany as of 2019, an annual increase of nine percent. The highest annual change in the countries included was seen in Switzerland, which saw the number of HNWI's increase by 14 percent between 2018 and 2019.
Advertisement
Advertisement
Population of high net worth individuals (HNWI) in Europe from 2013 to 2019, by country
(in 1,000s)
Profit from the additional features of your individual account
Currently, you are using a shared account. To use individual functions (e.g., mark statistics as favourites, set
statistic alerts) please log in with your personal account.
If you are an admin, please authenticate by logging in again.
Learn more about how Statista can support your business.
Capgemini. (July 9, 2020). Population of high net worth individuals (HNWI) in Europe from 2013 to 2019, by country (in 1,000s) [Graph]. In Statista. Retrieved June 20, 2025, from https://www.statista.com/statistics/424981/europe-high-net-worth-individuals-wealth-population/
Capgemini. "Population of high net worth individuals (HNWI) in Europe from 2013 to 2019, by country (in 1,000s)." Chart. July 9, 2020. Statista. Accessed June 20, 2025. https://www.statista.com/statistics/424981/europe-high-net-worth-individuals-wealth-population/
Capgemini. (2020). Population of high net worth individuals (HNWI) in Europe from 2013 to 2019, by country (in 1,000s). Statista. Statista Inc.. Accessed: June 20, 2025. https://www.statista.com/statistics/424981/europe-high-net-worth-individuals-wealth-population/
Capgemini. "Population of High Net worth Individuals (Hnwi) in Europe from 2013 to 2019, by Country (in 1,000s)." Statista, Statista Inc., 9 Jul 2020, https://www.statista.com/statistics/424981/europe-high-net-worth-individuals-wealth-population/
Capgemini, Population of high net worth individuals (HNWI) in Europe from 2013 to 2019, by country (in 1,000s) Statista, https://www.statista.com/statistics/424981/europe-high-net-worth-individuals-wealth-population/ (last visited June 20, 2025)
Population of high net worth individuals (HNWI) in Europe from 2013 to 2019, by country (in 1,000s) [Graph], Capgemini, July 9, 2020. [Online]. Available: https://www.statista.com/statistics/424981/europe-high-net-worth-individuals-wealth-population/