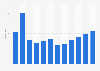
This statistic displays the percentage change in sales volumes of the retail trade in Greece year-on-year from 2004 to 2019. In 2019, retail sales rose by 0.8 percent compared to the same period in the previous year.
Percentage change in retail trade sales volume in Greece from 2004 to 2019*
Profit from the additional features of your individual account
Currently, you are using a shared account. To use individual functions (e.g., mark statistics as favourites, set
statistic alerts) please log in with your personal account.
If you are an admin, please authenticate by logging in again.
Learn more about how Statista can support your business.
OECD. (June 7, 2021). Percentage change in retail trade sales volume in Greece from 2004 to 2019* [Graph]. In Statista. Retrieved May 10, 2025, from https://www.statista.com/statistics/426546/retail-sales-volume-growth-european-greece/
OECD. "Percentage change in retail trade sales volume in Greece from 2004 to 2019*." Chart. June 7, 2021. Statista. Accessed May 10, 2025. https://www.statista.com/statistics/426546/retail-sales-volume-growth-european-greece/
OECD. (2021). Percentage change in retail trade sales volume in Greece from 2004 to 2019*. Statista. Statista Inc.. Accessed: May 10, 2025. https://www.statista.com/statistics/426546/retail-sales-volume-growth-european-greece/
OECD. "Percentage Change in Retail Trade Sales Volume in Greece from 2004 to 2019*." Statista, Statista Inc., 7 Jun 2021, https://www.statista.com/statistics/426546/retail-sales-volume-growth-european-greece/
OECD, Percentage change in retail trade sales volume in Greece from 2004 to 2019* Statista, https://www.statista.com/statistics/426546/retail-sales-volume-growth-european-greece/ (last visited May 10, 2025)
Percentage change in retail trade sales volume in Greece from 2004 to 2019* [Graph], OECD, June 7, 2021. [Online]. Available: https://www.statista.com/statistics/426546/retail-sales-volume-growth-european-greece/