This statistic displays the quantity of sugar confectionery consumed per day in the United Kingdom between 2008 and 2012, by age. In this four year period, individuals aged between 4 and 10 years old consumed 9 grams of sugar confectionery per day.
Advertisement
Advertisement
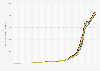
Quantity of sugar confectionery consumed per day in the United Kingdom (UK) from 2008 to 2012, by age
(in grams)
Characteristic
Sugars, including table sugar, preserves and sweet spreads
Sugar confectionery
1.5-3 years
4
4
4-10 years
6
9
11-18 years
6
7
19-64 years
11
2
65 years and over
14
1
02.557.51012.51517.5
Add this content to your personal favorites. These can be accessed from the favorites menu in the main navigation.
You have no right to use this feature.
Make sure to contact us if you are interested in scientific citation.
You can upgrade your account to enable this functionality for all statistics.
This feature is not available with your current account.Request access
Learn more about how Statista can support your business.
Public Health England, & Food Standards Agency. (May 14, 2014). Quantity of sugar confectionery consumed per day in the United Kingdom (UK) from 2008 to 2012, by age (in grams) [Graph]. In Statista. Retrieved July 11, 2025, from https://www.statista.com/statistics/437072/quantity-sugar-confectionery-consumed-in-the-united-kingdom/
Public Health England, und Food Standards Agency. "Quantity of sugar confectionery consumed per day in the United Kingdom (UK) from 2008 to 2012, by age (in grams)." Chart. May 14, 2014. Statista. Accessed July 11, 2025. https://www.statista.com/statistics/437072/quantity-sugar-confectionery-consumed-in-the-united-kingdom/
Public Health England, Food Standards Agency. (2014). Quantity of sugar confectionery consumed per day in the United Kingdom (UK) from 2008 to 2012, by age (in grams). Statista. Statista Inc.. Accessed: July 11, 2025. https://www.statista.com/statistics/437072/quantity-sugar-confectionery-consumed-in-the-united-kingdom/
Public Health England, and Food Standards Agency. "Quantity of Sugar Confectionery Consumed per Day in The United Kingdom (Uk) from 2008 to 2012, by Age (in Grams)." Statista, Statista Inc., 14 May 2014, https://www.statista.com/statistics/437072/quantity-sugar-confectionery-consumed-in-the-united-kingdom/
Public Health England & Food Standards Agency, Quantity of sugar confectionery consumed per day in the United Kingdom (UK) from 2008 to 2012, by age (in grams) Statista, https://www.statista.com/statistics/437072/quantity-sugar-confectionery-consumed-in-the-united-kingdom/ (last visited July 11, 2025)
Quantity of sugar confectionery consumed per day in the United Kingdom (UK) from 2008 to 2012, by age (in grams) [Graph], Public Health England, & Food Standards Agency, May 14, 2014. [Online]. Available: https://www.statista.com/statistics/437072/quantity-sugar-confectionery-consumed-in-the-united-kingdom/
Advertisement
Profit from additional features with an Employee Account
Please create an employee account to be able to mark statistics as favorites.
Then you can access your favorite statistics via the star in the header.
Profit from the additional features of your individual account
Currently, you are using a shared account. To use individual functions (e.g., mark statistics as favourites, set
statistic alerts) please log in with your personal account.
If you are an admin, please authenticate by logging in again.