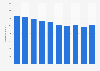
The year-on-year change in revenue of the beverages manufacturing industry in the Netherlands decreased by 10.3 percentage points (-66.88 percent) since the previous year. This was a significant decrease in the change in this industry.
Data was collected by the source from manufacturing companies with at least 20 employees.
Definitions provided by the source are as follows: Revenue: 'Value of sales of goods and services to third parties, taxes included (e.g excise, VAT), except SIC 11,12 and 19. Turnover includes main activity as well as secondary activities. Exception are the branches in the manufacturing industry, here turnover includes only sales of manufacturing turnover. Third parties are consumers and enterprises not belonging to (the Dutch part of) the own group of companies.' Change: 'Change, indicated as a percentage, with respect to the same month in the previous year. Statistics Netherlands calculates this on the basis of non-rounded figures.'
Profit from the additional features of your individual account
Currently, you are using a shared account. To use individual functions (e.g., mark statistics as favourites, set
statistic alerts) please log in with your personal account.
If you are an admin, please authenticate by logging in again.
Learn more about how Statista can support your business.
Centraal Bureau voor de Statistiek. (February 14, 2024). Percentage change in revenue of beverage manufacturing in the Netherlands from 2009 to 2023 [Graph]. In Statista. Retrieved June 06, 2025, from https://www.statista.com/statistics/440419/netherlands-beverage-manufacture-sales-growth/
Centraal Bureau voor de Statistiek. "Percentage change in revenue of beverage manufacturing in the Netherlands from 2009 to 2023." Chart. February 14, 2024. Statista. Accessed June 06, 2025. https://www.statista.com/statistics/440419/netherlands-beverage-manufacture-sales-growth/
Centraal Bureau voor de Statistiek. (2024). Percentage change in revenue of beverage manufacturing in the Netherlands from 2009 to 2023. Statista. Statista Inc.. Accessed: June 06, 2025. https://www.statista.com/statistics/440419/netherlands-beverage-manufacture-sales-growth/
Centraal Bureau voor de Statistiek. "Percentage Change in Revenue of Beverage Manufacturing in The Netherlands from 2009 to 2023." Statista, Statista Inc., 14 Feb 2024, https://www.statista.com/statistics/440419/netherlands-beverage-manufacture-sales-growth/
Centraal Bureau voor de Statistiek, Percentage change in revenue of beverage manufacturing in the Netherlands from 2009 to 2023 Statista, https://www.statista.com/statistics/440419/netherlands-beverage-manufacture-sales-growth/ (last visited June 06, 2025)
Percentage change in revenue of beverage manufacturing in the Netherlands from 2009 to 2023 [Graph], Centraal Bureau voor de Statistiek, February 14, 2024. [Online]. Available: https://www.statista.com/statistics/440419/netherlands-beverage-manufacture-sales-growth/