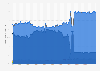
In 2023, the number of direct debit payments made in the Netherlands amounted to 2.34 billion. Despite fluctuations, the number of direct debit payments saw an upward trend recently, after notable decreases observed in 2014 and 2016.
Advertisement
Advertisement
Number of direct debit transactions in the Netherlands from 2000 to 2023
(in millions)
Characteristic
Direct debit transactions in millions
2023
2,342.01
2022
2,179.3
2021
1,613.85
2020
1,517.43
2019
1,472.34
2018
1,406.19
2017
1,210.98
2016
1,161.59
2015
1,288.99
2014
1,163.44
2013
1,329.71
2012
1,368.65
2011
1,340.38
05001,0001,5002,0002,5003,000
Add this content to your personal favorites. These can be accessed from the favorites menu in the main navigation.
You have no right to use this feature.
Make sure to contact us if you are interested in scientific citation.
You can upgrade your account to enable this functionality for all statistics.
This feature is not available with your current account.Request access
All figures are provisional; The source significantly changed its database in November 2023. This may mean methodology changes, or not all EU-27 countries reporting the same figures.
Supplementary notes
The figures have been taken from several publications.
Direct debit allows for the automatic deduction of money from one's bank account in order to pay regular bills - based on a prior authorization.
Learn more about how Statista can support your business.
ECB. (July 25, 2024). Number of direct debit transactions in the Netherlands from 2000 to 2023 (in millions) [Graph]. In Statista. Retrieved June 14, 2025, from https://www.statista.com/statistics/443335/direct-debit-payment-in-the-netherlands/
ECB. "Number of direct debit transactions in the Netherlands from 2000 to 2023 (in millions)." Chart. July 25, 2024. Statista. Accessed June 14, 2025. https://www.statista.com/statistics/443335/direct-debit-payment-in-the-netherlands/
ECB. (2024). Number of direct debit transactions in the Netherlands from 2000 to 2023 (in millions). Statista. Statista Inc.. Accessed: June 14, 2025. https://www.statista.com/statistics/443335/direct-debit-payment-in-the-netherlands/
ECB. "Number of Direct Debit Transactions in The Netherlands from 2000 to 2023 (in Millions)." Statista, Statista Inc., 25 Jul 2024, https://www.statista.com/statistics/443335/direct-debit-payment-in-the-netherlands/
ECB, Number of direct debit transactions in the Netherlands from 2000 to 2023 (in millions) Statista, https://www.statista.com/statistics/443335/direct-debit-payment-in-the-netherlands/ (last visited June 14, 2025)
Number of direct debit transactions in the Netherlands from 2000 to 2023 (in millions) [Graph], ECB, July 25, 2024. [Online]. Available: https://www.statista.com/statistics/443335/direct-debit-payment-in-the-netherlands/
Advertisement
Profit from additional features with an Employee Account
Please create an employee account to be able to mark statistics as favorites.
Then you can access your favorite statistics via the star in the header.
Profit from the additional features of your individual account
Currently, you are using a shared account. To use individual functions (e.g., mark statistics as favourites, set
statistic alerts) please log in with your personal account.
If you are an admin, please authenticate by logging in again.