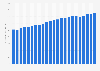
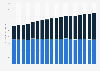
Between 2009 and 2021, the sales value of fresh fish and seafood purchased by French households has not followed the same pattern as the sales volume.
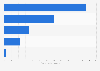
However, just like the sales volume, most French households have been purchasing their fresh fish and seafood products at hyper and supermarkets rather than at other retailers. In 2021, over 2.6 billion euros worth of fresh seafood products were purchased by French households, sales made at hyper and supermarkets amounted to around 1.6 billion euros.
Sales value of fresh fish and seafood purchased by French households between 2009 and 2021, by distribution channel
(in 1,000 euros)
Characteristic
Hyper and supermarkets*
Local marketplace
Fishmonger's
Total
2021
1,633,741€
308,353€
235,861€
2,617,960€
2020
1,582,638€
283,258€
249,445€
2,513,813€
2019
1,585,986€
279,983€
195,756€
1,386,055€
2018
1,574,524€
272,956€
198,575€
2,345,143€
2017
1,630,720€
298,556€
215,218€
2,425,116€
2016
1,625,952€
322,655€
229,924€
2,412,728€
2015
1,594,998€
321,508€
218,810€
2,306,983€
2014
1,637,962€
348,442€
220,874€
2,324,046€
2013
1,694,024€
336,471€
218,189€
2,362,369€
2012
1,687,554€
341,584€
225,705€
2,362,590€
2011
1,592,514€
362,595€
242,719€
2,319,615€
2010
1,619,590€
370,593€
257,327€
2,352,551€
2009
1,622,413€
357,407€
247,142€
2,343,367€
Zoomable Statistic: Select the range in the chart you want to zoom in on.
You have no right to use this feature.
Make sure to contact us if you are interested in scientific citation.
You can upgrade your account to enable this functionality for all statistics.
This feature is not available with your current account.Request access
Learn more about how Statista can support your business.
FranceAgriMer. (June 20, 2023). Sales value of fresh fish and seafood purchased by French households between 2009 and 2021, by distribution channel (in 1,000 euros) [Graph]. In Statista. Retrieved May 12, 2025, from https://www.statista.com/statistics/454478/fresh-fish-seafood-sales-value-distribution-channels-france/
FranceAgriMer. "Sales value of fresh fish and seafood purchased by French households between 2009 and 2021, by distribution channel (in 1,000 euros)." Chart. June 20, 2023. Statista. Accessed May 12, 2025. https://www.statista.com/statistics/454478/fresh-fish-seafood-sales-value-distribution-channels-france/
FranceAgriMer. (2023). Sales value of fresh fish and seafood purchased by French households between 2009 and 2021, by distribution channel (in 1,000 euros). Statista. Statista Inc.. Accessed: May 12, 2025. https://www.statista.com/statistics/454478/fresh-fish-seafood-sales-value-distribution-channels-france/
FranceAgriMer. "Sales Value of Fresh Fish and Seafood Purchased by French Households between 2009 and 2021, by Distribution Channel (in 1,000 Euros)." Statista, Statista Inc., 20 Jun 2023, https://www.statista.com/statistics/454478/fresh-fish-seafood-sales-value-distribution-channels-france/
FranceAgriMer, Sales value of fresh fish and seafood purchased by French households between 2009 and 2021, by distribution channel (in 1,000 euros) Statista, https://www.statista.com/statistics/454478/fresh-fish-seafood-sales-value-distribution-channels-france/ (last visited May 12, 2025)
Sales value of fresh fish and seafood purchased by French households between 2009 and 2021, by distribution channel (in 1,000 euros) [Graph], FranceAgriMer, June 20, 2023. [Online]. Available: https://www.statista.com/statistics/454478/fresh-fish-seafood-sales-value-distribution-channels-france/
Profit from additional features with an Employee Account
Please create an employee account to be able to mark statistics as favorites.
Then you can access your favorite statistics via the star in the header.
Profit from the additional features of your individual account
Currently, you are using a shared account. To use individual functions (e.g., mark statistics as favourites, set
statistic alerts) please log in with your personal account.
If you are an admin, please authenticate by logging in again.