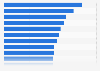
This statistic shows the sales volume of refreshments in British Columbia (BC) from 2012/13 to 2018/19. The sales volume of refreshments in the Canadian province of British Columbia reached approximately 56.34 million liters in the fiscal year ending March 2019.
Sales volume of refreshments in British Columbia (BC) from 2012/13 to 2018/19
(in million liters)
Characteristic
Sales volume in million liters
2018/19
56.34
2017/18
48.63
2016/17
43.36
2015/16
40.3
2014/15
35.25
2013/14
31.48
2012/13
27.55
010203040506070
Add this content to your personal favorites. These can be accessed from the favorites menu in the main navigation.
You have no right to use this feature.
Make sure to contact us if you are interested in scientific citation.
You can upgrade your account to enable this functionality for all statistics.
This feature is not available with your current account.Request access
Learn more about how Statista can support your business.
BCLDB. (July 22, 2019). Sales volume of refreshments in British Columbia (BC) from 2012/13 to 2018/19 (in million liters) [Graph]. In Statista. Retrieved June 02, 2025, from https://www.statista.com/statistics/456824/sales-of-coolers-and-ciders-in-bc-by-type-canada/
BCLDB. "Sales volume of refreshments in British Columbia (BC) from 2012/13 to 2018/19 (in million liters)." Chart. July 22, 2019. Statista. Accessed June 02, 2025. https://www.statista.com/statistics/456824/sales-of-coolers-and-ciders-in-bc-by-type-canada/
BCLDB. (2019). Sales volume of refreshments in British Columbia (BC) from 2012/13 to 2018/19 (in million liters). Statista. Statista Inc.. Accessed: June 02, 2025. https://www.statista.com/statistics/456824/sales-of-coolers-and-ciders-in-bc-by-type-canada/
BCLDB. "Sales Volume of Refreshments in British Columbia (Bc) from 2012/13 to 2018/19 (in Million Liters)." Statista, Statista Inc., 22 Jul 2019, https://www.statista.com/statistics/456824/sales-of-coolers-and-ciders-in-bc-by-type-canada/
BCLDB, Sales volume of refreshments in British Columbia (BC) from 2012/13 to 2018/19 (in million liters) Statista, https://www.statista.com/statistics/456824/sales-of-coolers-and-ciders-in-bc-by-type-canada/ (last visited June 02, 2025)
Sales volume of refreshments in British Columbia (BC) from 2012/13 to 2018/19 (in million liters) [Graph], BCLDB, July 22, 2019. [Online]. Available: https://www.statista.com/statistics/456824/sales-of-coolers-and-ciders-in-bc-by-type-canada/
Profit from additional features with an Employee Account
Please create an employee account to be able to mark statistics as favorites.
Then you can access your favorite statistics via the star in the header.
Profit from the additional features of your individual account
Currently, you are using a shared account. To use individual functions (e.g., mark statistics as favourites, set
statistic alerts) please log in with your personal account.
If you are an admin, please authenticate by logging in again.