Profit from the additional features of your individual account
Currently, you are using a shared account. To use individual functions (e.g., mark statistics as favourites, set
statistic alerts) please log in with your personal account.
If you are an admin, please authenticate by logging in again.
Learn more about how Statista can support your business.
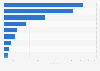
Beverage Information Group. (June 30, 2024). Number of rum product introductions in the United States from 2011 to 2023 [Graph]. In Statista. Retrieved June 27, 2025, from https://www.statista.com/statistics/468680/rum-product-introductions-us/
Beverage Information Group. "Number of rum product introductions in the United States from 2011 to 2023." Chart. June 30, 2024. Statista. Accessed June 27, 2025. https://www.statista.com/statistics/468680/rum-product-introductions-us/
Beverage Information Group. (2024). Number of rum product introductions in the United States from 2011 to 2023. Statista. Statista Inc.. Accessed: June 27, 2025. https://www.statista.com/statistics/468680/rum-product-introductions-us/
Beverage Information Group. "Number of Rum Product Introductions in The United States from 2011 to 2023." Statista, Statista Inc., 30 Jun 2024, https://www.statista.com/statistics/468680/rum-product-introductions-us/
Beverage Information Group, Number of rum product introductions in the United States from 2011 to 2023 Statista, https://www.statista.com/statistics/468680/rum-product-introductions-us/ (last visited June 27, 2025)
Number of rum product introductions in the United States from 2011 to 2023 [Graph], Beverage Information Group, June 30, 2024. [Online]. Available: https://www.statista.com/statistics/468680/rum-product-introductions-us/