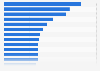
This statistic shows the amount of PM2.5 emissions attributable to the agriculture, forestry and fishing industry in the United Kingdom (UK) from 1990 to 2017. Emissions have decreased over the years, from 28,760 metric tons in 1990 to 5,980 metric tons in 2017.
PM2.5 emissions of the agriculture, forestry and fishing industry in the United Kingdom (UK) from 1990 to 2017
(in 1,000 metric tons)
Characteristic
Emissions in thousand metric tons
2017
5.98
2016
5.98
2015
6
2014
5.87
2013
5.84
2012
6.21
2011
6.51
2010
7.05
2005
10.41
2000
13.06
1995
14.11
1990
28.76
05101520253035
Add this content to your personal favorites. These can be accessed from the favorites menu in the main navigation.
You have no right to use this feature.
Make sure to contact us if you are interested in scientific citation.
You can upgrade your account to enable this functionality for all statistics.
This feature is not available with your current account.Request access
PM2.5 is defined as particulate matter of 2.5 micrometers or less in diameter and is known as fine particles. Sector and industry classification is based on the NACE code, which is the industry standard classification system for economic activities in the European Community.
Learn more about how Statista can support your business.
Office for National Statistics (UK). (June 5, 2019). PM2.5 emissions of the agriculture, forestry and fishing industry in the United Kingdom (UK) from 1990 to 2017 (in 1,000 metric tons) [Graph]. In Statista. Retrieved May 17, 2025, from https://www.statista.com/statistics/485028/fine-particles-emission-of-agriculture-united-kingdom/
Office for National Statistics (UK). "PM2.5 emissions of the agriculture, forestry and fishing industry in the United Kingdom (UK) from 1990 to 2017 (in 1,000 metric tons)." Chart. June 5, 2019. Statista. Accessed May 17, 2025. https://www.statista.com/statistics/485028/fine-particles-emission-of-agriculture-united-kingdom/
Office for National Statistics (UK). (2019). PM2.5 emissions of the agriculture, forestry and fishing industry in the United Kingdom (UK) from 1990 to 2017 (in 1,000 metric tons). Statista. Statista Inc.. Accessed: May 17, 2025. https://www.statista.com/statistics/485028/fine-particles-emission-of-agriculture-united-kingdom/
Office for National Statistics (UK). "Pm2.5 Emissions of The Agriculture, Forestry and Fishing Industry in The United Kingdom (Uk) from 1990 to 2017 (in 1,000 Metric Tons)." Statista, Statista Inc., 5 Jun 2019, https://www.statista.com/statistics/485028/fine-particles-emission-of-agriculture-united-kingdom/
Office for National Statistics (UK), PM2.5 emissions of the agriculture, forestry and fishing industry in the United Kingdom (UK) from 1990 to 2017 (in 1,000 metric tons) Statista, https://www.statista.com/statistics/485028/fine-particles-emission-of-agriculture-united-kingdom/ (last visited May 17, 2025)
PM2.5 emissions of the agriculture, forestry and fishing industry in the United Kingdom (UK) from 1990 to 2017 (in 1,000 metric tons) [Graph], Office for National Statistics (UK), June 5, 2019. [Online]. Available: https://www.statista.com/statistics/485028/fine-particles-emission-of-agriculture-united-kingdom/
Profit from additional features with an Employee Account
Please create an employee account to be able to mark statistics as favorites.
Then you can access your favorite statistics via the star in the header.
Profit from the additional features of your individual account
Currently, you are using a shared account. To use individual functions (e.g., mark statistics as favourites, set
statistic alerts) please log in with your personal account.
If you are an admin, please authenticate by logging in again.