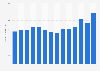
The processed plastics industry in Brazil generated a revenue of 123.4 billion Brazilian reais in 2023, a decrease in comparison to the previous year. Between 2016 and 2021, the sector experienced a year-on-year increase in revenue, peaking at almost 140 billion reais in 2021. Following an economic crisis which hit the country that year. In 2022, the production of processed plastics in Brazil amounted to 6.7 million metric tons.
Advertisement
Advertisement
Revenue of the processed plastics industry in Brazil from 2010 to 2023
(in billion Brazilian reais)
Characteristic
Revenue in billion Brazilian reais
2023
123.4
2022
124.3
2021
137.5
2020
97.5
2019
84.8
2018
81
2017
71.8
2016
71.1
0255075100125150175
Add this content to your personal favorites. These can be accessed from the favorites menu in the main navigation.
You have no right to use this feature.
Make sure to contact us if you are interested in scientific citation.
You can upgrade your account to enable this functionality for all statistics.
This feature is not available with your current account.Request access
Learn more about how Statista can support your business.
Associação Brasileira da Indústria do Plástico, & Website (simpesc.org.br). (September 24, 2024). Revenue of the processed plastics industry in Brazil from 2010 to 2023 (in billion Brazilian reais) [Graph]. In Statista. Retrieved July 22, 2025, from https://www.statista.com/statistics/487685/brazilian-plastic-processed-industry-revenue/
Associação Brasileira da Indústria do Plástico, und Website (simpesc.org.br). "Revenue of the processed plastics industry in Brazil from 2010 to 2023 (in billion Brazilian reais)." Chart. September 24, 2024. Statista. Accessed July 22, 2025. https://www.statista.com/statistics/487685/brazilian-plastic-processed-industry-revenue/
Associação Brasileira da Indústria do Plástico, Website (simpesc.org.br). (2024). Revenue of the processed plastics industry in Brazil from 2010 to 2023 (in billion Brazilian reais). Statista. Statista Inc.. Accessed: July 22, 2025. https://www.statista.com/statistics/487685/brazilian-plastic-processed-industry-revenue/
Associação Brasileira da Indústria do Plástico, and Website (simpesc.org.br). "Revenue of The Processed Plastics Industry in Brazil from 2010 to 2023 (in Billion Brazilian Reais)." Statista, Statista Inc., 24 Sep 2024, https://www.statista.com/statistics/487685/brazilian-plastic-processed-industry-revenue/
Associação Brasileira da Indústria do Plástico & Website (simpesc.org.br), Revenue of the processed plastics industry in Brazil from 2010 to 2023 (in billion Brazilian reais) Statista, https://www.statista.com/statistics/487685/brazilian-plastic-processed-industry-revenue/ (last visited July 22, 2025)
Revenue of the processed plastics industry in Brazil from 2010 to 2023 (in billion Brazilian reais) [Graph], Associação Brasileira da Indústria do Plástico, & Website (simpesc.org.br), September 24, 2024. [Online]. Available: https://www.statista.com/statistics/487685/brazilian-plastic-processed-industry-revenue/
Advertisement
Profit from additional features with an Employee Account
Please create an employee account to be able to mark statistics as favorites.
Then you can access your favorite statistics via the star in the header.
Profit from the additional features of your individual account
Currently, you are using a shared account. To use individual functions (e.g., mark statistics as favourites, set
statistic alerts) please log in with your personal account.
If you are an admin, please authenticate by logging in again.