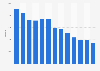
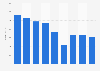
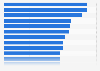
This statistic displays the average monthly number of employees of the New Look Retail Group worldwide from financial year 2012/13 to 2023/24, split by administration/distribution and retailing. During the most recent period, New Look had an average of 8,457 employees per month, the majority of which worked in the company's retail operations.
Advertisement
Advertisement
Average monthly number of New Look Group employees worldwide from financial year 2012/13 to 2023/24, by department
Adjust the presentation of the statistic and data points.
Share the statistic on social media channels or embed the statistic in your
website using "Embed Code", where available.
Cite this statistic and select one of the following formats: APA, Chicago, Harvard, MLA & Bluebook.
Print the statistic including description and metadata.
Chart type
Average monthly number of New Look Group employees worldwide from financial year 2012/13 to 2023/24, by department
Share this statistic
You have no right to use this feature.
Make sure to contact us if you are interested in scientific citation.
You can upgrade your account to enable this functionality for all statistics.
This feature is not available with your current account.Request access
Includes directors.
Financial years run in the 52 weeks ending on the last working day of March for each consecutive year.
Data for 2011/12 to 2019/20 is taken from previous annual reports by the source. 2017/18 data was restated in the 2018/19 report.
Learn more about how Statista can support your business.
New Look. (July 23, 2024). Average monthly number of New Look Group employees worldwide from financial year 2012/13 to 2023/24, by department [Graph]. In Statista. Retrieved June 26, 2025, from https://www.statista.com/statistics/493009/new-look-employee-numbers-by-department/
New Look. "Average monthly number of New Look Group employees worldwide from financial year 2012/13 to 2023/24, by department." Chart. July 23, 2024. Statista. Accessed June 26, 2025. https://www.statista.com/statistics/493009/new-look-employee-numbers-by-department/
New Look. (2024). Average monthly number of New Look Group employees worldwide from financial year 2012/13 to 2023/24, by department. Statista. Statista Inc.. Accessed: June 26, 2025. https://www.statista.com/statistics/493009/new-look-employee-numbers-by-department/
New Look. "Average Monthly Number of New Look Group Employees Worldwide from Financial Year 2012/13 to 2023/24, by Department." Statista, Statista Inc., 23 Jul 2024, https://www.statista.com/statistics/493009/new-look-employee-numbers-by-department/
New Look, Average monthly number of New Look Group employees worldwide from financial year 2012/13 to 2023/24, by department Statista, https://www.statista.com/statistics/493009/new-look-employee-numbers-by-department/ (last visited June 26, 2025)
Average monthly number of New Look Group employees worldwide from financial year 2012/13 to 2023/24, by department [Graph], New Look, July 23, 2024. [Online]. Available: https://www.statista.com/statistics/493009/new-look-employee-numbers-by-department/
Advertisement
Profit from additional features with an Employee Account
Please create an employee account to be able to mark statistics as favorites.
Then you can access your favorite statistics via the star in the header.
Profit from the additional features of your individual account
Currently, you are using a shared account. To use individual functions (e.g., mark statistics as favourites, set
statistic alerts) please log in with your personal account.
If you are an admin, please authenticate by logging in again.