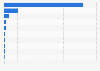
The statistic depicts the share of pay TV subscribers in the United States from 2015 to 2018, sorted by type. In 2018, the share of cord cutters amounted to ** percent, an increase of *** percent from 2017. The share of traditional pay TV subscribers also decreased, and as of 2018 has dropped by more than twenty percent in three years.
Profit from the additional features of your individual account
Currently, you are using a shared account. To use individual functions (e.g., mark statistics as favourites, set
statistic alerts) please log in with your personal account.
If you are an admin, please authenticate by logging in again.
Learn more about how Statista can support your business.
PwC. (January 30, 2019). Share of pay TV subscribers in the United States from 2015 to 2018, by type [Graph]. In Statista. Retrieved July 20, 2025, from https://www.statista.com/statistics/497267/share-pay-tv-nonviewers-cord-cut-never-usa/
PwC. "Share of pay TV subscribers in the United States from 2015 to 2018, by type." Chart. January 30, 2019. Statista. Accessed July 20, 2025. https://www.statista.com/statistics/497267/share-pay-tv-nonviewers-cord-cut-never-usa/
PwC. (2019). Share of pay TV subscribers in the United States from 2015 to 2018, by type. Statista. Statista Inc.. Accessed: July 20, 2025. https://www.statista.com/statistics/497267/share-pay-tv-nonviewers-cord-cut-never-usa/
PwC. "Share of Pay Tv Subscribers in The United States from 2015 to 2018, by Type." Statista, Statista Inc., 30 Jan 2019, https://www.statista.com/statistics/497267/share-pay-tv-nonviewers-cord-cut-never-usa/
PwC, Share of pay TV subscribers in the United States from 2015 to 2018, by type Statista, https://www.statista.com/statistics/497267/share-pay-tv-nonviewers-cord-cut-never-usa/ (last visited July 20, 2025)
Share of pay TV subscribers in the United States from 2015 to 2018, by type [Graph], PwC, January 30, 2019. [Online]. Available: https://www.statista.com/statistics/497267/share-pay-tv-nonviewers-cord-cut-never-usa/