Adjust the presentation of the statistic and data points.
Share the statistic on social media channels or embed the statistic in your
website using "Embed Code", where available.
Cite this statistic and select one of the following formats: APA, Chicago, Harvard, MLA & Bluebook.
Print the statistic including description and metadata.
Chart type
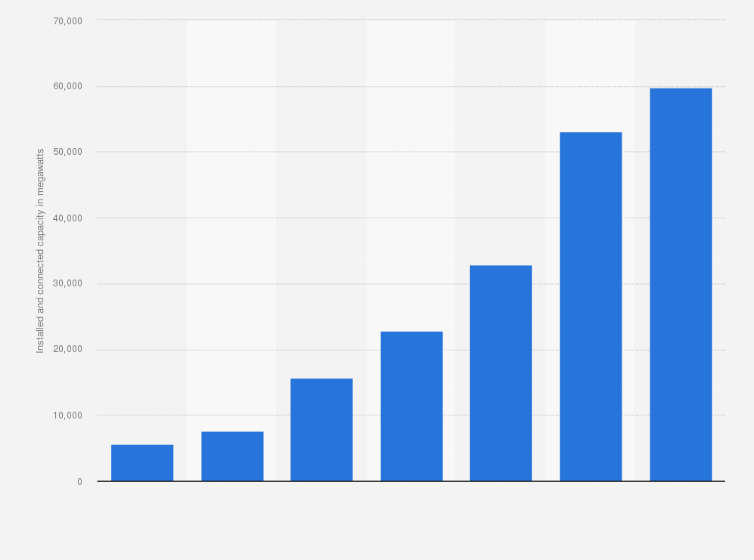
Annual net solar photovoltaic capacity additions installed in the European Union from 2017 to 2024
Share this statistic
You have no right to use this feature.
Make sure to contact us if you are interested in scientific citation.
You can upgrade your account to enable this functionality for all statistics.
This feature is not available with your current account.Request access
Figures from 2017 to 2019 refer to the EU-28 (including the United Kingdom). As of 2021, figures correspond to the EU-27, in which data for the United Kingdom is no longer included.
The source did not provide values for 2020.
This statistic was compiled using several releases of the publication.
Learn more about how Statista can support your business.
EurObserv'ER. (April 29, 2025). Annual net solar photovoltaic capacity additions installed in the European Union from 2017 to 2024 (in megawatts) [Graph]. In Statista. Retrieved July 06, 2025, from https://www.statista.com/statistics/497440/installed-photovoltaic-capacity-european-union/
EurObserv'ER. "Annual net solar photovoltaic capacity additions installed in the European Union from 2017 to 2024 (in megawatts)." Chart. April 29, 2025. Statista. Accessed July 06, 2025. https://www.statista.com/statistics/497440/installed-photovoltaic-capacity-european-union/
EurObserv'ER. (2025). Annual net solar photovoltaic capacity additions installed in the European Union from 2017 to 2024 (in megawatts). Statista. Statista Inc.. Accessed: July 06, 2025. https://www.statista.com/statistics/497440/installed-photovoltaic-capacity-european-union/
EurObserv'ER. "Annual Net Solar Photovoltaic Capacity Additions Installed in The European Union from 2017 to 2024 (in Megawatts)." Statista, Statista Inc., 29 Apr 2025, https://www.statista.com/statistics/497440/installed-photovoltaic-capacity-european-union/
EurObserv'ER, Annual net solar photovoltaic capacity additions installed in the European Union from 2017 to 2024 (in megawatts) Statista, https://www.statista.com/statistics/497440/installed-photovoltaic-capacity-european-union/ (last visited July 06, 2025)
Annual net solar photovoltaic capacity additions installed in the European Union from 2017 to 2024 (in megawatts) [Graph], EurObserv'ER, April 29, 2025. [Online]. Available: https://www.statista.com/statistics/497440/installed-photovoltaic-capacity-european-union/
Advertisement
Profit from additional features with an Employee Account
Please create an employee account to be able to mark statistics as favorites.
Then you can access your favorite statistics via the star in the header.
Profit from the additional features of your individual account
Currently, you are using a shared account. To use individual functions (e.g., mark statistics as favourites, set
statistic alerts) please log in with your personal account.
If you are an admin, please authenticate by logging in again.