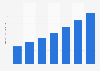
The statistic shows the year-on-year growth in spending on IT implementation from 2015 to 2019. In 2015, implementation spending grew 3.7 percent on 2014 spending levels.
Growth in spending on information technology (IT) implementation worldwide from 2015 to 2019
Profit from the additional features of your individual account
Currently, you are using a shared account. To use individual functions (e.g., mark statistics as favourites, set
statistic alerts) please log in with your personal account.
If you are an admin, please authenticate by logging in again.
Learn more about how Statista can support your business.
IDC. (August 23, 2016). Growth in spending on information technology (IT) implementation worldwide from 2015 to 2019 [Graph]. In Statista. Retrieved May 04, 2025, from https://www.statista.com/statistics/505181/worldwide-it-implementation-spending-growth/
IDC. "Growth in spending on information technology (IT) implementation worldwide from 2015 to 2019." Chart. August 23, 2016. Statista. Accessed May 04, 2025. https://www.statista.com/statistics/505181/worldwide-it-implementation-spending-growth/
IDC. (2016). Growth in spending on information technology (IT) implementation worldwide from 2015 to 2019. Statista. Statista Inc.. Accessed: May 04, 2025. https://www.statista.com/statistics/505181/worldwide-it-implementation-spending-growth/
IDC. "Growth in Spending on Information Technology (It) Implementation Worldwide from 2015 to 2019." Statista, Statista Inc., 23 Aug 2016, https://www.statista.com/statistics/505181/worldwide-it-implementation-spending-growth/
IDC, Growth in spending on information technology (IT) implementation worldwide from 2015 to 2019 Statista, https://www.statista.com/statistics/505181/worldwide-it-implementation-spending-growth/ (last visited May 04, 2025)
Growth in spending on information technology (IT) implementation worldwide from 2015 to 2019 [Graph], IDC, August 23, 2016. [Online]. Available: https://www.statista.com/statistics/505181/worldwide-it-implementation-spending-growth/