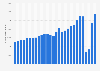
In 2020 and 2021, the number of monthly visits to the National Museums Liverpool in England, decreased significantly due to the coronavirus (COVID-19) pandemic. In March 2020, this cultural institution attracted nearly ***** thousand visitors, dropping from *** thousand visits in March 2019. After four months of zero visitors in the beginning of 2021, the number of visits to the National Museums Liverpool reached **** thousand by June of that year. August was the busiest month of 2021, with the establishment welcoming roughly *** thousand guests that month. Due to the restrictions enacted during the pandemic, museums and galleries in the United Kingdom had to stay closed for several months in 2020 and 2021.
*Museums and galleries in the United Kingdom were closed from mid-March to June 2020 due to the coronavirus (COVID-19) pandemic. They were closed again from November 5 to December 1, 2020 and from January to mid-May 2021.
Figures concern visits to all museums and galleries which are part of the National Museums Liverpool.
Profit from the additional features of your individual account
Currently, you are using a shared account. To use individual functions (e.g., mark statistics as favourites, set
statistic alerts) please log in with your personal account.
If you are an admin, please authenticate by logging in again.
Learn more about how Statista can support your business.
Department for Digital, Culture, Media and Sport (UK). (February 16, 2022). Number of monthly visits to National Museums Liverpool in England from March 2018 to December 2021 (in 1,000s) [Graph]. In Statista. Retrieved July 15, 2025, from https://www.statista.com/statistics/508141/national-museums-liverpool-monthly-visits-england-uk/
Department for Digital, Culture, Media and Sport (UK). "Number of monthly visits to National Museums Liverpool in England from March 2018 to December 2021 (in 1,000s)." Chart. February 16, 2022. Statista. Accessed July 15, 2025. https://www.statista.com/statistics/508141/national-museums-liverpool-monthly-visits-england-uk/
Department for Digital, Culture, Media and Sport (UK). (2022). Number of monthly visits to National Museums Liverpool in England from March 2018 to December 2021 (in 1,000s). Statista. Statista Inc.. Accessed: July 15, 2025. https://www.statista.com/statistics/508141/national-museums-liverpool-monthly-visits-england-uk/
Department for Digital, Culture, Media and Sport (UK). "Number of Monthly Visits to National Museums Liverpool in England from March 2018 to December 2021 (in 1,000s)." Statista, Statista Inc., 16 Feb 2022, https://www.statista.com/statistics/508141/national-museums-liverpool-monthly-visits-england-uk/
Department for Digital, Culture, Media and Sport (UK), Number of monthly visits to National Museums Liverpool in England from March 2018 to December 2021 (in 1,000s) Statista, https://www.statista.com/statistics/508141/national-museums-liverpool-monthly-visits-england-uk/ (last visited July 15, 2025)
Number of monthly visits to National Museums Liverpool in England from March 2018 to December 2021 (in 1,000s) [Graph], Department for Digital, Culture, Media and Sport (UK), February 16, 2022. [Online]. Available: https://www.statista.com/statistics/508141/national-museums-liverpool-monthly-visits-england-uk/