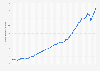
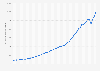
Greenhouse gas emissions from lime production in the United Kingdom have oscillated since 1990, peaking at 1.7 million metric tons of carbon dioxide equivalent (MtCO₂e) in 1998. Currently, emissions from lime production average around one MtCO₂e. Industrial processes are one of the least emitting sources of GHG emissions in the UK. In this sector, iron and steel production emissions are highest.
Advertisement
Advertisement
Greenhouse gas emissions from lime production in the United Kingdom (UK) from 1990 to 2023
(in million metric tons of carbon dioxide equivalent)
Profit from the additional features of your individual account
Currently, you are using a shared account. To use individual functions (e.g., mark statistics as favourites, set
statistic alerts) please log in with your personal account.
If you are an admin, please authenticate by logging in again.
Learn more about how Statista can support your business.
Department for Energy Security and Net-Zero (UK). (February 6, 2025). Greenhouse gas emissions from lime production in the United Kingdom (UK) from 1990 to 2023 (in million metric tons of carbon dioxide equivalent) [Graph]. In Statista. Retrieved June 13, 2025, from https://www.statista.com/statistics/509125/greenhouse-gas-emissions-lime-production-in-the-united-kingdom-uk/
Department for Energy Security and Net-Zero (UK). "Greenhouse gas emissions from lime production in the United Kingdom (UK) from 1990 to 2023 (in million metric tons of carbon dioxide equivalent)." Chart. February 6, 2025. Statista. Accessed June 13, 2025. https://www.statista.com/statistics/509125/greenhouse-gas-emissions-lime-production-in-the-united-kingdom-uk/
Department for Energy Security and Net-Zero (UK). (2025). Greenhouse gas emissions from lime production in the United Kingdom (UK) from 1990 to 2023 (in million metric tons of carbon dioxide equivalent). Statista. Statista Inc.. Accessed: June 13, 2025. https://www.statista.com/statistics/509125/greenhouse-gas-emissions-lime-production-in-the-united-kingdom-uk/
Department for Energy Security and Net-Zero (UK). "Greenhouse Gas Emissions from Lime Production in The United Kingdom (Uk) from 1990 to 2023 (in Million Metric Tons of Carbon Dioxide Equivalent)." Statista, Statista Inc., 6 Feb 2025, https://www.statista.com/statistics/509125/greenhouse-gas-emissions-lime-production-in-the-united-kingdom-uk/
Department for Energy Security and Net-Zero (UK), Greenhouse gas emissions from lime production in the United Kingdom (UK) from 1990 to 2023 (in million metric tons of carbon dioxide equivalent) Statista, https://www.statista.com/statistics/509125/greenhouse-gas-emissions-lime-production-in-the-united-kingdom-uk/ (last visited June 13, 2025)
Greenhouse gas emissions from lime production in the United Kingdom (UK) from 1990 to 2023 (in million metric tons of carbon dioxide equivalent) [Graph], Department for Energy Security and Net-Zero (UK), February 6, 2025. [Online]. Available: https://www.statista.com/statistics/509125/greenhouse-gas-emissions-lime-production-in-the-united-kingdom-uk/