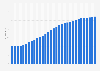
The ratio of government expenditure to GDP in North Macedonia amounted to about 36.73 percent in 2024. From 1997 to 2024, the ratio rose by approximately 4.46 percentage points, though the increase followed an uneven trajectory rather than a consistent upward trend. Between 2024 and 2030, the ratio will rise by around 1.04 percentage points, showing an overall upward trend with periodic ups and downs.
Shown here is the general government expenditure as a share of the national gross domestic product. As defined by the International Monetary Fund, the general government expenditure consists of total expense and the net acquisition of nonfinancial assets. The gross domestic product represents the total value of final goods and services produced during a year.
Advertisement
Advertisement
Ratio of government expenditure to GDP in North Macedonia from 1997 to 2030
Characteristic
Ratio of government expenditure to GDP
2030
37.77%
2029
37.57%
2028
37.87%
2027
38.21%
2026
38.5%
2025
39.14%
2024
36.73%
2023
35.49%
2022
35.04%
2021
35.27%
2020
36.4%
2019
31.41%
2018
30.27%
0%10%20%30%40%50%
Add this content to your personal favorites. These can be accessed from the favorites menu in the main navigation.
You have no right to use this feature.
Make sure to contact us if you are interested in scientific citation.
You can upgrade your account to enable this functionality for all statistics.
This feature is not available with your current account.Request access
Learn more about how Statista can support your business.
IMF. (April 29, 2025). Ratio of government expenditure to GDP in North Macedonia from 1997 to 2030 [Graph]. In Statista. Retrieved July 15, 2025, from https://www.statista.com/statistics/510253/ratio-of-government-expenditure-to-gross-domestic-product-gdp-in-macedonia/
IMF. "Ratio of government expenditure to GDP in North Macedonia from 1997 to 2030." Chart. April 29, 2025. Statista. Accessed July 15, 2025. https://www.statista.com/statistics/510253/ratio-of-government-expenditure-to-gross-domestic-product-gdp-in-macedonia/
IMF. (2025). Ratio of government expenditure to GDP in North Macedonia from 1997 to 2030. Statista. Statista Inc.. Accessed: July 15, 2025. https://www.statista.com/statistics/510253/ratio-of-government-expenditure-to-gross-domestic-product-gdp-in-macedonia/
IMF. "Ratio of Government Expenditure to Gdp in North Macedonia from 1997 to 2030." Statista, Statista Inc., 29 Apr 2025, https://www.statista.com/statistics/510253/ratio-of-government-expenditure-to-gross-domestic-product-gdp-in-macedonia/
IMF, Ratio of government expenditure to GDP in North Macedonia from 1997 to 2030 Statista, https://www.statista.com/statistics/510253/ratio-of-government-expenditure-to-gross-domestic-product-gdp-in-macedonia/ (last visited July 15, 2025)
Ratio of government expenditure to GDP in North Macedonia from 1997 to 2030 [Graph], IMF, April 29, 2025. [Online]. Available: https://www.statista.com/statistics/510253/ratio-of-government-expenditure-to-gross-domestic-product-gdp-in-macedonia/
Advertisement
Profit from additional features with an Employee Account
Please create an employee account to be able to mark statistics as favorites.
Then you can access your favorite statistics via the star in the header.
Profit from the additional features of your individual account
Currently, you are using a shared account. To use individual functions (e.g., mark statistics as favourites, set
statistic alerts) please log in with your personal account.
If you are an admin, please authenticate by logging in again.