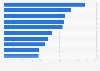
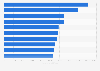
In 2023, the adjusted expenses incurred by an average for-profit hospital for one day of inpatient care amounted to 2,529 U.S. dollars in the United States. This ranged from over 5,799 U.S. dollars in Nebraska to just 597 U.S. dollars in Maine.
Adjusted expenses per inpatient day for for-profit hospitals in the United States in 2023, by state
Release date represents the date figures were accessed.
Missing states = no for-profit hospital existed in these states.
The source adds the following information: "Includes all operating and non-operating expenses for registered US community hospitals, defined as nonfederal short-term general and other special hospitals whose facilities and services are available to the public. Adjusted expenses per inpatient day include expenses incurred for both inpatient and outpatient care; inpatient days are adjusted higher to reflect an estimate of the volume of outpatient services. It is important to note that these figures are only an estimate of expenses incurred by the hospital to provide a day of inpatient care and are not a substitute for either actual charges or reimbursement for care provided."
Profit from the additional features of your individual account
Currently, you are using a shared account. To use individual functions (e.g., mark statistics as favourites, set
statistic alerts) please log in with your personal account.
If you are an admin, please authenticate by logging in again.
Learn more about how Statista can support your business.
KFF. (May 21, 2025). Adjusted expenses per inpatient day for for-profit hospitals in the United States in 2023, by state [Graph]. In Statista. Retrieved June 06, 2025, from https://www.statista.com/statistics/511328/adjusted-expenses-per-inpatient-day-in-for-profit-hospitals-in-the-us-by-state/
KFF. "Adjusted expenses per inpatient day for for-profit hospitals in the United States in 2023, by state." Chart. May 21, 2025. Statista. Accessed June 06, 2025. https://www.statista.com/statistics/511328/adjusted-expenses-per-inpatient-day-in-for-profit-hospitals-in-the-us-by-state/
KFF. (2025). Adjusted expenses per inpatient day for for-profit hospitals in the United States in 2023, by state. Statista. Statista Inc.. Accessed: June 06, 2025. https://www.statista.com/statistics/511328/adjusted-expenses-per-inpatient-day-in-for-profit-hospitals-in-the-us-by-state/
KFF. "Adjusted Expenses per Inpatient Day for For-profit Hospitals in The United States in 2023, by State." Statista, Statista Inc., 21 May 2025, https://www.statista.com/statistics/511328/adjusted-expenses-per-inpatient-day-in-for-profit-hospitals-in-the-us-by-state/
KFF, Adjusted expenses per inpatient day for for-profit hospitals in the United States in 2023, by state Statista, https://www.statista.com/statistics/511328/adjusted-expenses-per-inpatient-day-in-for-profit-hospitals-in-the-us-by-state/ (last visited June 06, 2025)
Adjusted expenses per inpatient day for for-profit hospitals in the United States in 2023, by state [Graph], KFF, May 21, 2025. [Online]. Available: https://www.statista.com/statistics/511328/adjusted-expenses-per-inpatient-day-in-for-profit-hospitals-in-the-us-by-state/